- Dynatrace Community
- Learn
- Dynatrace tips
- Re: JVM Heap Metrics on Dynatrace
- Subscribe to RSS Feed
- Mark Topic as New
- Mark Topic as Read
- Pin this Topic for Current User
- Printer Friendly Page
Monitor JVM Heap Metrics in Dynatrace
- Mark as New
- Subscribe to RSS Feed
- Permalink
04 Aug 2015
08:37 PM
- last edited on
09 Dec 2025
07:46 AM
by
![]() IzabelaRokita
IzabelaRokita
Summary: Dynatrace provides JVM heap metrics to monitor memory allocation and garbage collection. This thread explains how to access these metrics, interpret them, and optimise application performance using Dynatrace dashboards.
The most crucial information for optimizing the performance of a JVM is the allocation of memory heaps, knowing when the garbage collection activity suspends a process, and how much memory was utilized during this cycle.
How can you see the real-time JVM metrics for your application?
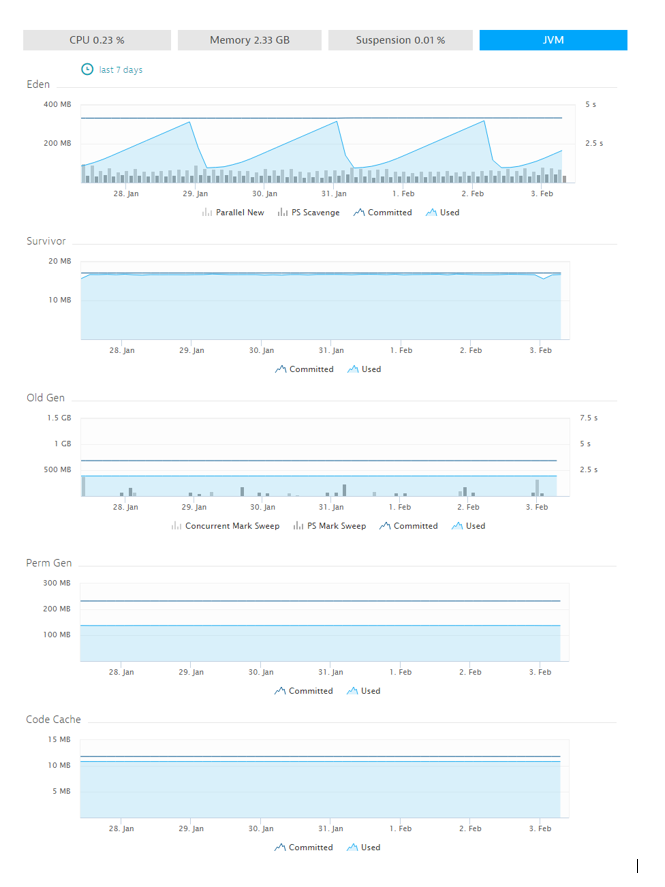
Dynatrace provides visibility into all the JVM metrics. This information is available for each Java process in the following way: 
The memory pool sizes need to be configured to obtain the optimum garbage collection behavior. In this blog post, I will discuss the various memory pools and their impact on the application's performance.
Eden Space: also known as Young Generation. This space contains all the newly created objects. Most objects are dereferenced or made unreachable soon after their creation.
Survivor space: The objects that were not dereferenced in the young generation will be copied to survivor space by the garbage collector.
Old Generation: The largest memory pool is for long living objects. The objects get copied to this space as they leave the survivor spaces.
Perm Gen: This pool keeps information about the application classes. For most applications, this space does not require any configuration.
Code Cache: The memory used for compilation and storage of native code.
The basic principle guiding these memory pools is that the Eden space should be large enough to hold all temporary objects, and the old gen space should hold all permanent objects. The old gen space needs to be configured such that after a major GC, at least 50% of the space remains free, or the GC run times are too high.
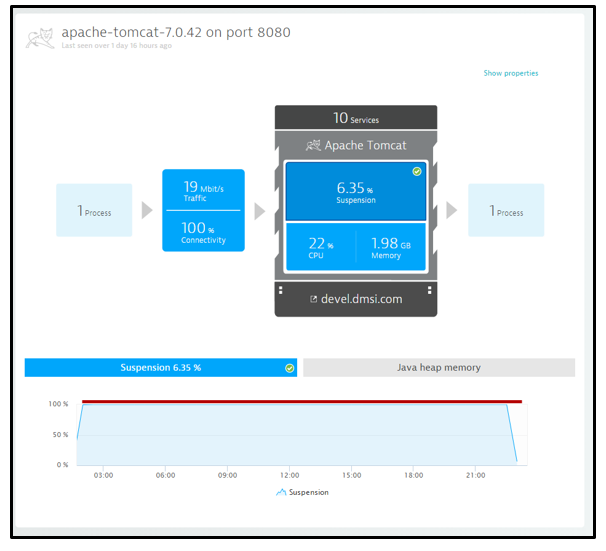
Garbage collections are “Stop the World” events, as all the application threads are stopped until the operation completes. As the Eden space keeps short-lived objects, minor GC is a fast process that does not affect the application, whereas major GC takes significantly longer as it needs to check all the live objects. This operation needs to be minimized because it will render the application unresponsive for its duration. The unresponsiveness of the application is measured only by Dynatrace and displayed as a value called Suspension, indicating the duration during which the application was in a suspended state due to the Major GC. This is an important variable to measure as increased GC activity causes a problem only when it is rendering an application unresponsive.

A large number of Major GCs eventually leads to timeout errors for the application. These are diagnosed by Dynatrace and are shown as Garbage Collection Problems on the dashboard. If there are no problems reported, you can navigate to the Java process and click on the area showing Suspension on the infographic, and get all the information.
What to read next:
📖 PRO TIP: Alert on OneAgent running outdated version
📖 TIP#1: Extracting values from a JSON_ARRAY using DQL
📖 Pro Tip: Solving the Unsolved - Automating Dynatrace SSL Certificate Monitoring
- Labels:
-
java
-
metrics
-
tips and tricks
- Mark as New
- Subscribe to RSS Feed
- Permalink
05 Aug 2015 06:32 AM
Even if GC suspension doesn't slow down your app it might consume a lot of resources. Dynatrace also shows you how much CPU the GC is using as can be seen here. Dynatrace now covers CPU consumption for all GCs, even CMS.
- Mark as New
- Subscribe to RSS Feed
- Permalink
30 Nov 2023 05:22 PM
Thanks for the great information you shared but I have a question.
How are these details captured by Dynatrace? I'm looking to understand what is the process how JVM metrics are being monitored by dynatrace. Can you please share the details around it.
- Mark as New
- Subscribe to RSS Feed
- Permalink
09 May 2024 04:17 AM
@alijamshed
OneAgent gets the memory values directly from the JVM via default API
https://docs.oracle.com/javase/8/docs/api/java/lang/management/MemoryMXBean.html
Featured Posts
