- Dynatrace Community
- Learn
- Dynatrace tips
- Kubernetes - How to deal with updated container metrics (running & desired containers)
- Subscribe to RSS Feed
- Mark Topic as New
- Mark Topic as Read
- Pin this Topic for Current User
- Printer Friendly Page
Kubernetes - How to deal with updated container metrics (running & desired containers)
- Mark as New
- Subscribe to RSS Feed
- Permalink
07 Mar 2022
07:35 AM
- last edited on
19 Oct 2022
03:01 PM
by
![]() MaciejNeumann
MaciejNeumann
What changes and what is the impact?
We are deprecating the pod and node dimension (used for splitting/filtering) of the running and desired containers metrics.
The following is only relevant, if you’re using one of these two metrics on a dashboard or in a custom alert.
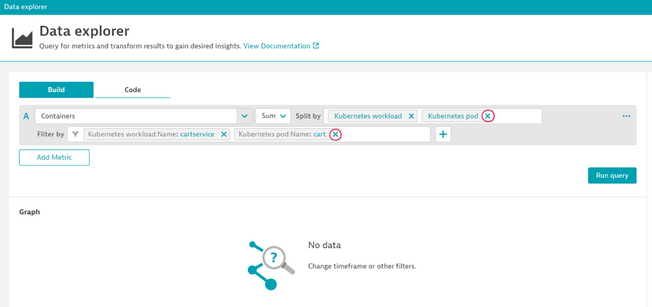
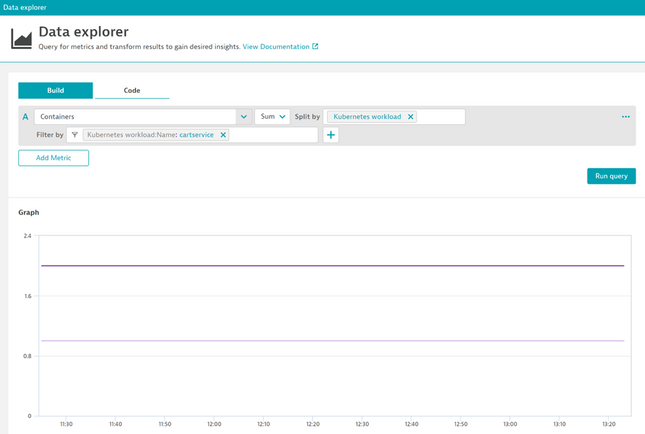
Impact on dashboards: If you’re filtering or splitting using the pod or node dimension, you won’t be able to chart these two metrics anymore. The recommended option would be to simply remove the dimensions and display the metric aggregated on a higher-level dimension. For example, for pods the next higher-level aggregation would be to use the workload as shown in the screenshots.
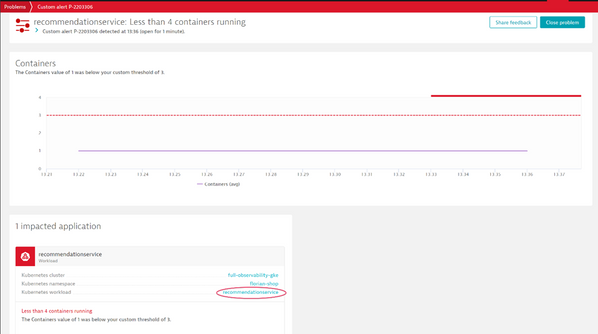
Impact on custom events for alerting: Any alert using pod or node dimension of the mentioned two metrics for filtering, splitting or as the primary entity, won’t work after this change. As for the dashboards, we recommend migrating the alert by using the next higher-level dimension. E.g., workload dimension, instead of the pod dimension.
How can I still drill down to the exact pod?
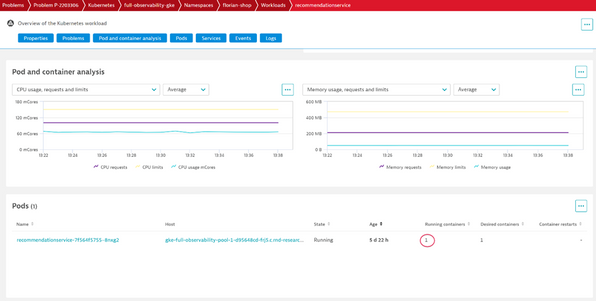
While we are removing the pod dimension from the metric, you will still be able to see live values for running and desired containers on the workload screen (see workload screenshot below).
We recommend the following troubleshooting workflow: Start, by setting your custom events for alerting on workload level aggregates. Navigating from the problem card to the workload, allows you to further drill down into the exact pod using the pods list embedded in this screen.
When will this change happen?
This change will be released with Dynatrace Active Gate version 1.237.
- Mark as New
- Subscribe to RSS Feed
- Permalink
09 Jan 2023 08:39 PM
Thank you for the Notice @florian_g 🙂
Featured Posts


