- Dynatrace Community
- Learn
- Dynatrace tips
- Re: Kubernetes overview sample dashboard with the new Kubernetes metric set
- Subscribe to RSS Feed
- Mark Topic as New
- Mark Topic as Read
- Pin this Topic for Current User
- Printer Friendly Page
Kubernetes overview sample dashboard with the new Kubernetes metric set
- Mark as New
- Subscribe to RSS Feed
- Permalink
22 Sep 2022
05:54 PM
- last edited on
29 May 2023
09:29 AM
by
![]() MaciejNeumann
MaciejNeumann
Hi Folks,
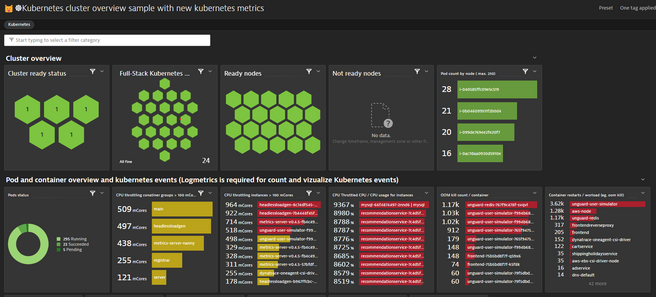
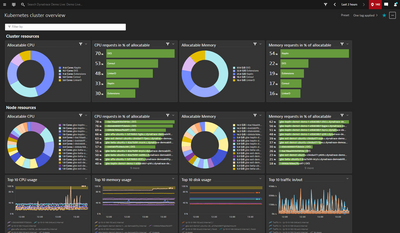
Please check my new Kubernetes overview dashbord in the live Demo. Inspiration came form @florian_g
github post.
dynatrace-api/metric-expressions-for-k8s.md at master · Dynatrace/dynatrace-api · GitHub .
🐱☸Kubernetes cluster overview sample with new kubernetes metrics - Dynatrace Demo Live: Demo Live - Dynatrace:
https://demoid.live.dynatrace.com/#dashboard;gtf=-90d%20to%20now;gf=all;id=0817dba0-0d29-42d7-909b-f266a10cce04
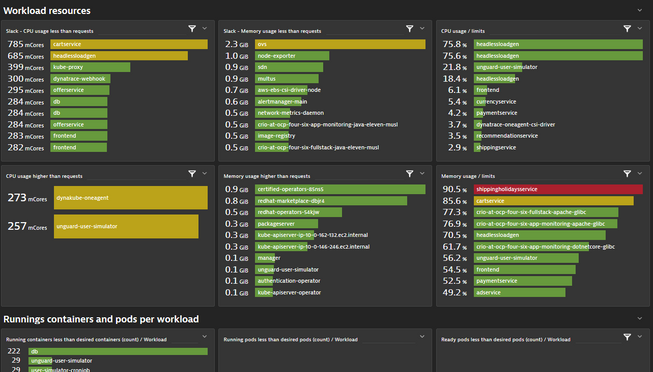
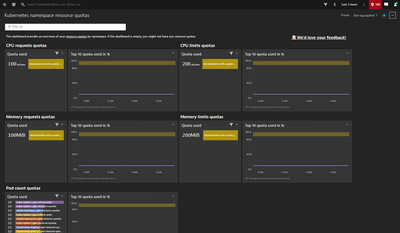
Some pics:
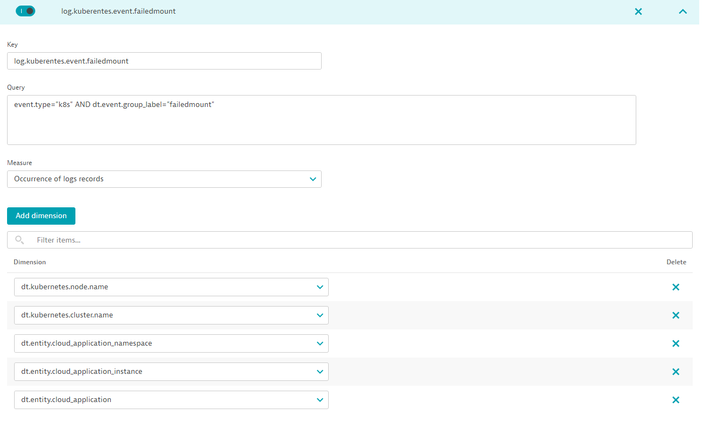
It was developed on a classicfullstack instrumented openshift. Kubernetes log metrics are required for the full use (or you can remove it from the dashborad after clone 😉 ) . Example:
Play with the dashboard time frame, dashboard tiles custom time frames, thresholds and colouring.
In the data explorer I tried to use readable metric expressions:
(
builtin:containers.memory.residentSetBytes:avg:parents:parents:splitBy("dt.entity.cloud_application"):sum
/ builtin:kubernetes.workload.limits_memory:avg:splitBy("dt.entity.cloud_application"):sum
* 100
)
:splitBy("dt.entity.cloud_application")
:setUnit(Percent)
:sort(value(avg,descending))
:limit(10)
I hope it will be usefull and you can reuse it (mybe parts) in the every day life monitoring.
Br, Mizső
- Mark as New
- Subscribe to RSS Feed
- Permalink
30 Sep 2022 12:53 PM
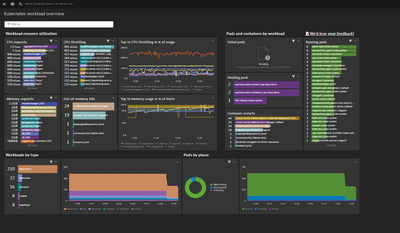
great job @Mizső - we also used the chance of using the new metrics in the preset dashboards to give them a slight overhaul. Any feedback is welcome - there's now also a link to a form within the dashboards for providing feedback 🙂 If you're running on Saas, you should already have the new layout in your tenant 🙂
- Mark as New
- Subscribe to RSS Feed
- Permalink
30 Sep 2022 01:01 PM
Hi @florian_g,
Thanks for the info. My clinets are on managed only. 😞 Two weeks later I will have it in 1.252 managed. 🙂
To be honest I have already checked it quickly in the live demo 1.251 environment. 😉
Have a nice weekend.
Br, Misző
Featured Posts
