- Dynatrace Community
- Learn
- Dynatrace tips
- PRO TIP - DQL for Query Usage Cost and Audit.
- Subscribe to RSS Feed
- Mark Topic as New
- Mark Topic as Read
- Pin this Topic for Current User
- Printer Friendly Page
- Mark as New
- Subscribe to RSS Feed
- Permalink
22 Feb 2024
01:08 AM
- last edited on
26 Feb 2024
12:35 PM
by
![]() MaciejNeumann
MaciejNeumann
So, I assumed that something like this might be already posted. But since I couldn't find it I will just drop it here, just in case.
So with the new and shiny DQL and GA of DPS moving forward, we need a way to "Have a glance" at what the hell the users are querying. I expect that the lovely "Consumption" gets back for DPS at some point. But while we wait let's fix it with a Query lol.
So these two use cases have the same basic query:
fetch dt.system.events
| filter matchesValue(event.kind, "QUERY_EXECUTION_EVENT")
| sort timestamp DESC
So for those that do not know, there are a bunch of buckets with system info... cool info.
But with the event kind "QUERY_EXECUTION_EVENT" you get those juicy executed queries, doing a little math you can get (based on the default rate card) how much GB and $$$ are being dropped in those queries:
fetch dt.system.events
| filter matchesValue(event.kind, "QUERY_EXECUTION_EVENT")
| fieldsAdd consumidoGiB = ((scanned_bytes) * 0.000000000931322574615478515625)
| fieldsAdd consumidoGiBCosto = consumidoGiB * 0.00365
| fieldsKeep timestamp, consumidoGiBCosto, consumidoGiB, scanned_bytes, analysis_timeframe.start, analysis_timeframe.end, client.application_context, query_string, user, user.email
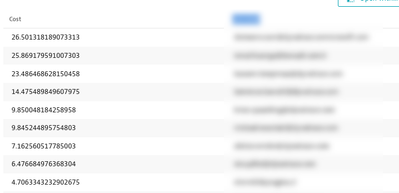
| summarize Cost = sum(consumidoGiBCosto), by:{user.email}
| sort Cost desc
Look to those Juicy USD spent in queries!
And from where?
Anyhow.. this consumes too.. but so far I have only seen consumptions of maybe 11 MiB scanned, for 30 days in a "big" environment. So is cheap (IMO)
Now.. one could also do something similar for those buckets that ARE important... you know, the one that might have PII stuff maybe.
fetch dt.system.events
| filter matchesValue(event.kind, "QUERY_EXECUTION_EVENT")
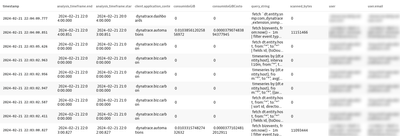
| fieldskeep timestamp, bucket, delivered_records, status, user, user.email, query_string
| sort timestamp DESC
It is pretty much a simple query, the result is self-explanatory.
So, anyway hope you guys find it useful to track down those users who might consume... a little too much or maybe those apps and automations that have a high cost!
Cheers
Solved! Go to Solution.
- Labels:
-
dql
-
licensing
-
tips and tricks
- Mark as New
- Subscribe to RSS Feed
- Permalink
27 Feb 2024 09:31 PM
Great, thanks @Dant3
- Mark as New
- Subscribe to RSS Feed
- Permalink
27 Feb 2024 10:24 PM
Amazing tip @Dant3, thanks for sharing!
- Mark as New
- Subscribe to RSS Feed
- Permalink
13 Mar 2024 05:18 AM
Thats interesting. Thanks @Dant3 for sharing this.
- Mark as New
- Subscribe to RSS Feed
- Permalink
18 Mar 2024 12:38 PM
Thats interesting. Thanks
- Mark as New
- Subscribe to RSS Feed
- Permalink
10 Mar 2025 03:09 PM
Great Info. BTW, is that possible to find the events in GB for each management zones (total number of events (in GB) in each MZs)? I will give a rough idea, how much it will cost if we are querying it.
- Mark as New
- Subscribe to RSS Feed
- Permalink
01 Oct 2025 09:30 PM
Hi @Dant3
We’ve noticed a billing increase over the last two weeks in our Dynatrace account, and we would like to understand the root cause. Specifically, we want to:
- Identify which events, usage types, or capabilities are contributing to the increased costs.
- Understand whether old Davis AI-based detections, which were set to inactive in July, could be related, since currently the Davis AI option appears disabled for all dashboard charts.
- Get guidance on how to query or extract detailed billing and usage data that can help us pinpoint the high-cost events.
Could you please provide a DQL query or approach that would allow us to see:
- Capability name
- Environment
- Entity (host, service, workflow, or log source)
- Usage type
- Usage volume
- Cost in USD
- Timestamp
…and any other details that would help us fully understand the billing increase?
This will help us take steps to optimize and reduce costs effectively.
- Mark as New
- Subscribe to RSS Feed
- Permalink
16 Oct 2025 04:42 PM
I am interested in the answer to this question.
- Mark as New
- Subscribe to RSS Feed
- Permalink
07 Apr 2026 02:42 PM
Amazing, Thanks @Dant3 - Is it possible to view the raw query instead of *? This will be helpful to view the exact unmasked query strings.
Featured Posts


