- Dynatrace Community
- Dynatrace
- Extend
- Extensions
- Extensions 2.0 SNMP generic network device
- Subscribe to RSS Feed
- Mark Topic as New
- Mark Topic as Read
- Pin this Topic for Current User
- Printer Friendly Page
Extensions 2.0 SNMP generic network device
- Mark as New
- Subscribe to RSS Feed
- Permalink
08 Jun 2022
08:30 AM
- last edited on
30 May 2023
07:38 AM
by
![]() MaciejNeumann
MaciejNeumann
I'm trying Snmp extention.
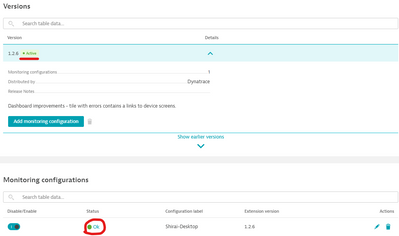
After setting the monitored device, Status Ok is displayed.
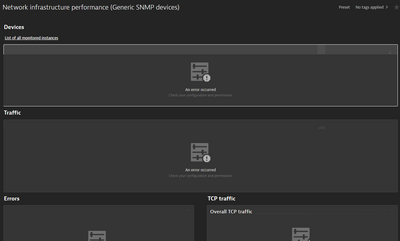
After setting the monitored device, Status Ok is displayed. However, nothing is displayed on the dashboard. Is there something wrong with the setting method?
This is the first time I have used Extensions 2.0.
- Labels:
-
dashboards classic
-
extensions
-
snmp
- Mark as New
- Subscribe to RSS Feed
- Permalink
08 Jun 2022 10:40 AM
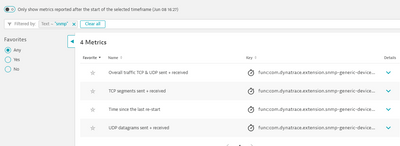
I confirmed that 4 metrics have been added in the metric browser.
However, the metric was not set to a value.
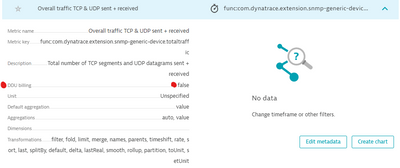
The DDU license in the Environment was fine. However, when I looked at the details of the metric, DDU billing was displayed as "false".
Thank you for your advice.
- Mark as New
- Subscribe to RSS Feed
- Permalink
08 Jun 2022 11:37 AM
Those 4 metrics aren't actually "real" metrics, they're just definitions of functions on how to combine other metrics into new ones. The regular metrics is nowhere to be seen in that list.
- Mark as New
- Subscribe to RSS Feed
- Permalink
09 Jun 2022 10:04 AM - edited 09 Jun 2022 10:13 AM
The device we tested this time was Windows10 with the SNMP service enabled.
When I tried it on another device (SNMP enabled printer), I was able to get the information normally.
The reason why the information cannot be obtained in Windows10 is unknown.
Has anyone tried this extension on Windows10 ?
- Mark as New
- Subscribe to RSS Feed
- Permalink
17 Jun 2022 09:26 PM
Have you got any luck on this?
