- Dynatrace Community
- Ask
- Extensions
- JMX plugin not showing hung thread information
- Subscribe to RSS Feed
- Mark Topic as New
- Mark Topic as Read
- Pin this Topic for Current User
- Printer Friendly Page
- Mark as New
- Subscribe to RSS Feed
- Permalink
14 May 2021 06:25 AM
Hi Folks,
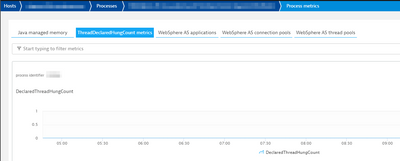
I trying to fetch "Hung Thread" for IBM WebSphere via JMX plugin however, it does not show up anything under process metrics.
I'm using "DeclaredThreadHungCount" metric.
Has anybody faced the similar issue? I would need a help here.
Regards,
AK
Solved! Go to Solution.
- Labels:
-
extensions
- Mark as New
- Subscribe to RSS Feed
- Permalink
14 May 2021 02:12 PM - edited 14 May 2021 02:16 PM
It's most likely that WebSphere is simply not reporting that value. You'd be able to confirm that by using another way of checking the JMX values such as Jconsole (edit: since this is PMI you may need to use another means like the WebSphere admin console itself). So this probably requires some WebSphere side configuration.
From some searching it looks like for hung threads like that to be detected there needs to be a thread monitor threshold defined: https://www.ibm.com/docs/en/was-nd/8.5.5?topic=chdp-hung-threads-in-java-platform-enterprise-edition...
What I expect is the cause though is that per this page: https://www.ibm.com/docs/en/was/8.5.5?topic=pdo-thread-pool-counters that metric is in the 'MAX' overhead category and requires you be be capturing 'ALL' metrics or have configured it explicitly to capture that which is not set by default. So if you want that metric to be reported by WebSphere I'd check that PMI setting but also consider the overhead it says to expect.
Featured Posts

