This website uses Cookies. Click Accept to agree to our website's cookie use as described in our Privacy Policy. Click Preferences to customize your cookie settings.
Extensions
Turn on suggestions
Auto-suggest helps you quickly narrow down your search results by suggesting possible matches as you type.
- Dynatrace Community
- Ask
- Extensions
- Re: Not seeing DB connection pool metrics in Cloud Foundry tomcat instances
Options
- Subscribe to RSS Feed
- Mark Topic as New
- Mark Topic as Read
- Pin this Topic for Current User
- Printer Friendly Page
Options
- Mark as New
- Subscribe to RSS Feed
- Permalink
20 Jul 2020
08:01 PM
- last edited on
20 Aug 2024
02:15 PM
by
![]() Michal_Gebacki
Michal_Gebacki
I am not able to see = DB connection pool metrics in Cloud Foundry tomcat instances. Do we know how these can be monitored or enable in Dynatrace
Solved! Go to Solution.
Labels:
- Labels:
-
cloud foundry
-
databases
Reply
3 REPLIES 3
Options
- Mark as New
- Subscribe to RSS Feed
- Permalink
20 Jul 2020 09:36 PM
Hi Vinnu,
I don't believe that connection pool metrics are captured out of the box. You can configure them through the UI though. Go to Settings -> Monitoring Technologies -> Add new technology monitoring -> Add JMX/PMI extension. See screenshot:
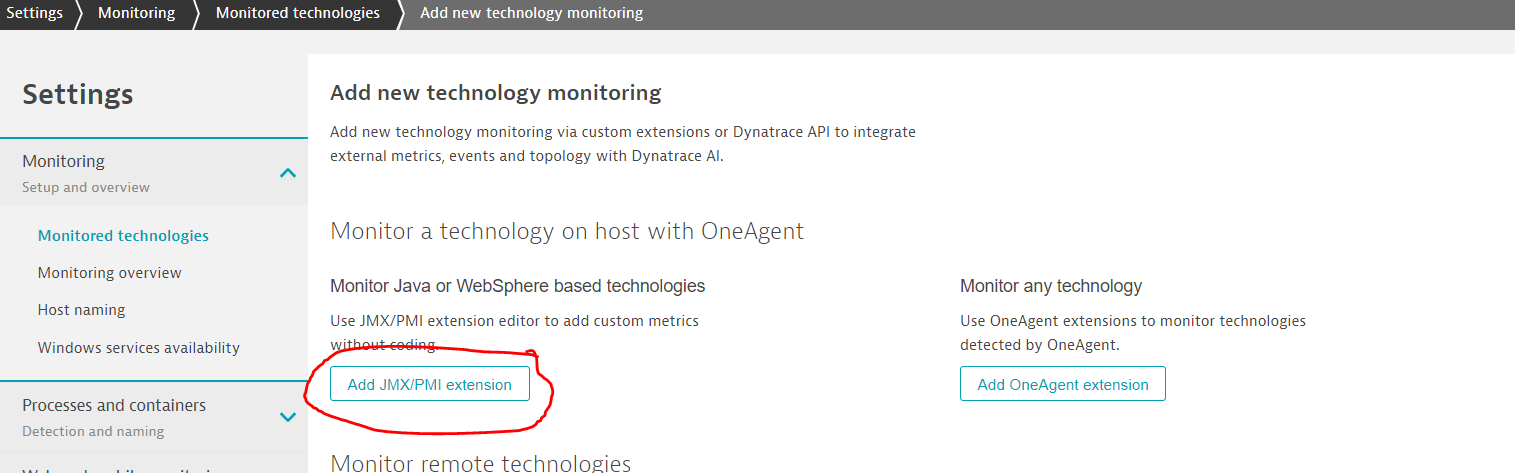
From there you can use the wizard to find the tomcat instance and then select the connection pool metric.
You can find the document for this feature here: https://www.dynatrace.com/support/help/extend-dynatrace/extensions/jmx-extensions/jmx-extensions/
Thanks
-Dallas
Reply
Options
- Mark as New
- Subscribe to RSS Feed
- Permalink
12 May 2021 07:30 PM
Hi Dallas,
we added the JMX Db2 plugin and we exposed JMX in our spring boot app. still we are not seeing JDBC pool metrics in dynatrace
Spring config on our app
endpoints:
jmx:
exposure:
include: "metrics, info, beans, conditions, health, loggers, mappings"
let me know what else need to be done to see these metrics
Vinnu
Options
- Mark as New
- Subscribe to RSS Feed
- Permalink
25 May 2021 02:24 PM
Hi Vinnu,
A few points to check:
- You referred to a "Db2" plugin so first would verify you're referring to one of these described here: https://www.dynatrace.com/news/blog/simplify-troubleshooting-with-ai-powered-insights-into-connectio...
- If so first make sure it wasn't disabled at the environment level or at the individual host level
- Second, this extension supports specific Mbeans/attributes that come along with connection pool implementations such as: https://tomcat.apache.org/tomcat-7.0-doc/jdbc-pool.html. A good one to check for to verify it can work would be to check that you can see Mbeans under the Catalina domain, with the type as "datasource." You should see attributes such as 'numActive.' If you are using another connection pooling implementation e.g. Hikari it will not be covered by this extension. You can use the editor Dallas mentioned as a way to see if those attributes are discoverable. Any other means of checking Mbean values is also fine (e.g. Jconsole).
- If it is a different connection pool implementation you can check if there are other metrics that look applicable in the editor.
- Lastly, I see a number of posts around the Web around how JMX can be disabled, it seem there are a lot for the Spring Framework specifically. If you are very confident your implementation meets the previous criteria this is where I would try to explore and ideally see if you can get the metrics exposed via JMX and checking via some means other than Dynatrace before looking to an issue within Dynatrace itself.


Featured Posts
