Turn on suggestions
Auto-suggest helps you quickly narrow down your search results by suggesting possible matches as you type.
- Dynatrace Community
- Dynatrace
- Extend
- Extensions
- Re: OSB queue length
Options
- Subscribe to RSS Feed
- Mark Topic as New
- Mark Topic as Read
- Pin this Topic for Current User
- Printer Friendly Page
OSB queue length
Options
- Mark as New
- Subscribe to RSS Feed
- Permalink
17 Sep 2017
02:20 PM
- last edited on
28 Jun 2021
02:20 PM
by
![]() MaciejNeumann
MaciejNeumann
Hi
We are in POC on a system that is using Oracle Service Bus and prospect asked us if we can see the queue length of the WebLogic.
We have tried to builda JMX plugin and wrote the following JSON but are not seeing any data.
Did anyone write such a plugin for Dynatrace ?
Yos @Gil G.
{
  "version": "0.96",
  "name": "custom.jmx.OSB",
  "type": "JMX",
  "processTypes":  [ 17 ],
  "entity": "PROCESS_GROUP_INSTANCE",
  "configUI" : {
    "displayName": "OSB JMX"
  },
  "metrics": [
    {
      "timeseries": {
        "key": "TX_count",
	    "unit": "Count",
        "dimensions": ["rx_pid"]
      },
      "source": {
        "domain": "com.bea.wli.monitoring.ServiceDomainMBean",
        "keyProperties": {
          "type": "SERVICE",
		  "name": "*"
        },
        "attribute": "Transport.message-count",
        "calculateDelta": false,
        "calculateRate": false,
        "aggregation": "SUM"
      }
    }
  ],
  "ui":
  {
  "group" : "OSB metrics",
  "title" : "Matrix title",
  "series" : [
				{
				"key" : "TX_count",
				"aggregation" : "avg"
				}
			]

  }
}
Labels:
- Labels:
-
extensions
15 REPLIES 15
Options
- Mark as New
- Subscribe to RSS Feed
- Permalink
10 Oct 2017 09:37 AM
I think you have the value for "attribute" wrong. I guess it should be just "message-count", not "Transport.message-count". Are you able to retrieve the mbean attributes with JConsole? Can you post a screenshot of the mbean in JConsole?
If JConsole is not an option for you, try a command line JMX client such as JMXTerm. Attach to the server process, and post the following (JMX term command) :
- Domains list (domains)
- MBeans list in the com.bea.wli.monitoring.ServiceDomainMBean domain (beans -d com.bea.wli.monitoring.ServiceDomainMBean )
- MBean attributes for the com.bea.wli.monitoring.ServiceDomainMBean:type=SERVICE Bean (get -d com.bea.wli.monitoring.ServiceDomainMBean -b com.bea.wli.monitoring.ServiceDomainMBean:type=SERVICE *)
Unfortunately I don't have a configured Weblogic server running, so I can't try it.
Certified Dynatrace Master | Alanata a.s., Slovakia, Dynatrace Master Partner
Options
- Mark as New
- Subscribe to RSS Feed
- Permalink
10 Oct 2017 09:49 AM
Hi Julius,
Thanks for your detailed answer!
Will try to get this from the prospect or by my self and update ASAP
Yos
dynatrace certificated professional - dynatrace master partner - Matrix Soft Ware Division - Israel
Options
- Mark as New
- Subscribe to RSS Feed
- Permalink
10 Oct 2017 09:27 PM
Hi again Julius,
The change to use only message-count with out the Transport. didn't changed much .... still cant see "OSB JMX" in the web logic process dashboard.
And prospect didn't managed to get either of your way to show us their mbeans and instead offer this link https://docs.oracle.com/middleware/11119/wls/WLACH/pagehelp/JMSjmsservermonitordestinationstitle.htm... not quite sure if this can help us.
Yos
dynatrace certificated professional - dynatrace master partner - Matrix Soft Ware Division - Israel
Options
- Mark as New
- Subscribe to RSS Feed
- Permalink
11 Oct 2017 07:58 AM
Have you been able to browse the MBeans using jconsole or jmxterm and pull the mbean attributes?
For example using jmxterm and standard JVM Mbeans (domain java.lang):
Start JMX Term and list jvms running on the system (PIDs are shown in the list):
$ java -jar jmxterm-1.0.0-uber.jar
Welcome to JMX terminal. Type "help" for available commands.
$>jvms
5562     ( ) - davmail-4.7.3.2438.jar
5660     ( ) - jmxterm-1.0.0-uber.jar
$>open 5562
#Connection to 5562 is opened
Then list JMX domains in that JVM:
$>domains
#following domains are available
JMImplementation
com.sun.management
java.lang
java.nio
java.util.logging
List Mbeans in the java.lang domain:
$>beans -d java.lang
#domain = java.lang:
java.lang:name=Code Cache,type=MemoryPool
java.lang:name=CodeCacheManager,type=MemoryManager
...
java.lang:type=Runtime
java.lang:type=Threading
Get a single attribute from a particular mbean:
$>get -d java.lang java.lang:type=Runtime Uptime
#mbean = java.lang:type=Runtime:
Uptime = 395058;
Get all attributes from a particular mbean:
$>get -d java.lang java.lang:type=Runtime *
#mbean = java.lang:type=Runtime:
SpecName = Java Virtual Machine Specification;
SpecVendor = Oracle Corporation;
SpecVersion = 1.8;
....
Are you able to find the information you are looking for using JMXTerm? First you have to make sure the information you are looking for is exposed in JMX for example using the JMXTerm approach. If this is working, you can write your JMX Plugin for Dynatrace using the correct values (domain, key properties, attribute, ... ).
Certified Dynatrace Master | Alanata a.s., Slovakia, Dynatrace Master Partner
Options
- Mark as New
- Subscribe to RSS Feed
- Permalink
11 Oct 2017 07:59 AM
For the example above, Dynatrace plugin snipplet should look like this:
{
                        "timeseries": {
                                "key": "Uptime",
                                "unit": "Count",
                                "dimensions": [
                                        "rx_pid"
                                ]
                        },
                        "source": {
                                "domain": "java.lang",
                                "keyProperties": {
                                        "type": "Runtime"
                                },
                                "allowAdditionalKeys": false,
                                "attribute": "Uptime",
                                "calculateDelta": false,
                                "calculateRate": false,
                                "aggregation": "MAX"
                        }
                }
Certified Dynatrace Master | Alanata a.s., Slovakia, Dynatrace Master Partner
Options
- Mark as New
- Subscribe to RSS Feed
- Permalink
11 Oct 2017 10:47 AM
Hi Julius,
Let me start with thanks for your kind an patient guidance!
Since I have no access to the prospect machines to run the JMXterm, I have asked them to run the list of commands you suggest and to send me the outcomes.
Its look like it done for AppMon - https://github.com/Dynatrace/Dynatrace-AppMon-Oracle-Weblogic-Monitoring-Plugin using those JMX data
Yos
dynatrace certificated professional - dynatrace master partner - Matrix Soft Ware Division - Israel
Options
- Mark as New
- Subscribe to RSS Feed
- Permalink
14 Oct 2017 08:56 AM
Hi Julius,
So it was a long lasting effort to understand how to approach this WebLogic 10.3 and finally we succeed to reach the data, We think and more than that hope, with Jconsole
For example the follow AR_anique is onw que that the prospect's guys want to see with in the WebLogic process window
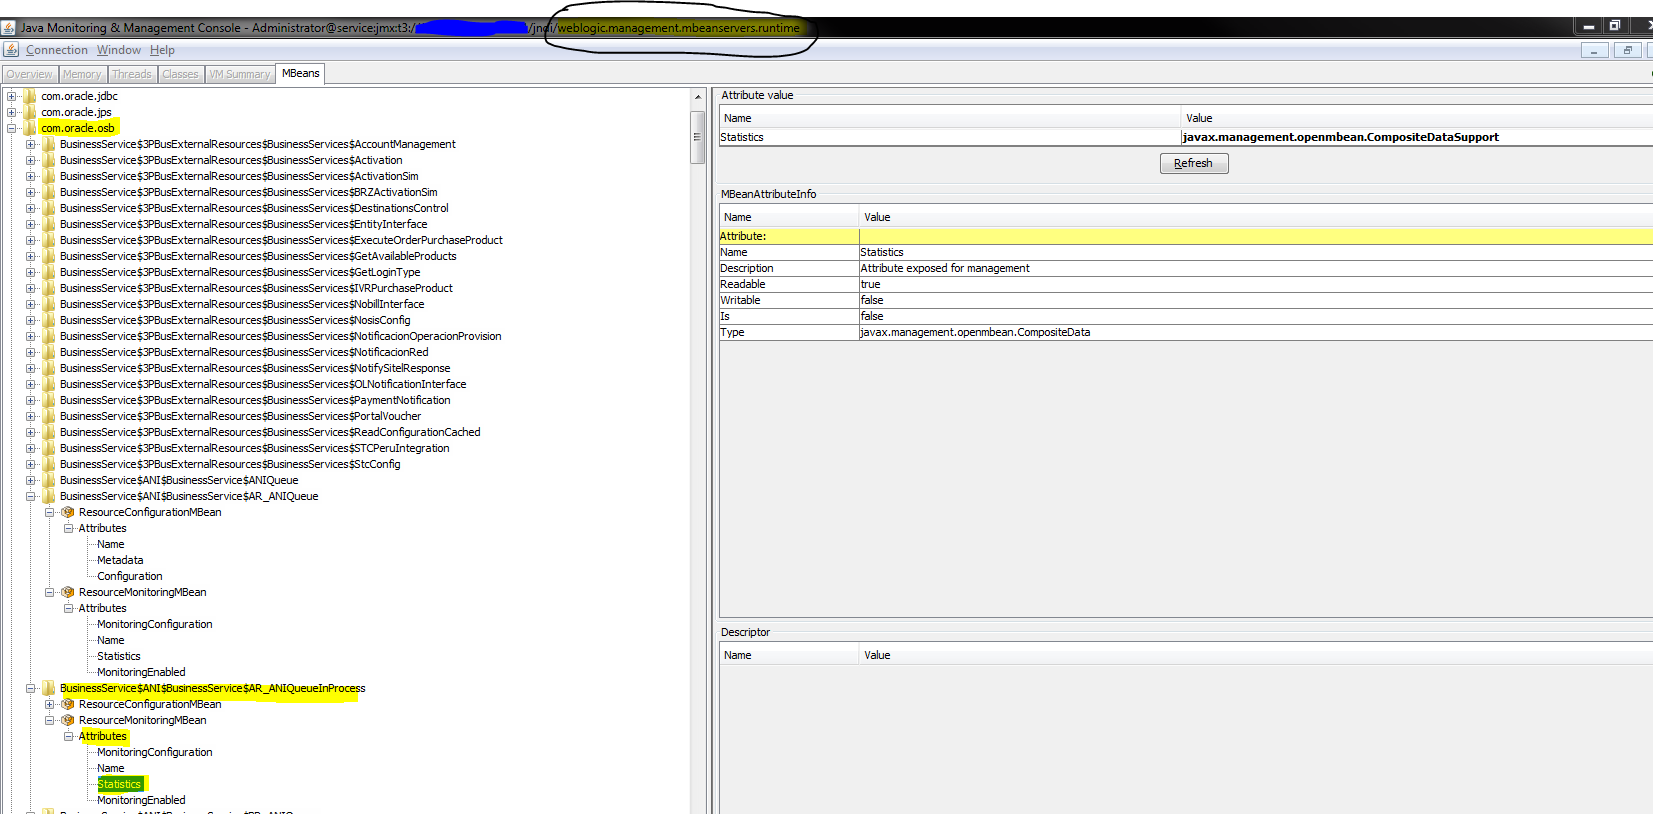
Can you point us please what data fields do we need to take from the Jconsole and where to place them with in the plugin definition?
And thanks in advance
Yos
dynatrace certificated professional - dynatrace master partner - Matrix Soft Ware Division - Israel
Options
- Mark as New
- Subscribe to RSS Feed
- Permalink
16 Oct 2017 09:24 AM
I think the json snipplet for sourcing the attribute should look like this:
"source": {
	"domain": "com.oracle.osb",
	"keyProperties": {
		"Name": "BusinessService$ANI$BusinessService$AR_ANIQueueInProcess",
		"Type": "ResourceMonitoringMBean"
	},
	"allowAdditionalKeys": false,
	"attribute": "Statistics",
	"calculateDelta": false,
	"calculateRate": false,
	"aggregation": "MAX"
}
However I'm not quite sure, since it's a composite datatype. I don't know if dyntrace supports that and it's not expanded on your screenshot, so it's impossible to know individual attributes in this composite data type. Maybe @Jakub M. knows if it's supported and what is the proper syntax to collect data from JMX composite data types. My first guess would be like this:
"attribute": "Statistics.SomeAttribute"
If you don't have access to the system, you can try extracting data from composite data type on any JVM using the java.lang:type=GarbageCollector mbeans. The LastGcInfo is also a composite data type. So you can actually find out the correct syntax for the JMX extension.
Certified Dynatrace Master | Alanata a.s., Slovakia, Dynatrace Master Partner
Options
- Mark as New
- Subscribe to RSS Feed
- Permalink
16 Oct 2017 11:42 AM
Hi Juluis,
We are trying to understand where
our problem, i.e. don't see any data from the installed plugin under the
processes information as expected.
We moved to look at more simple
data for ConnectionsTotalCount

and those are the attributes :
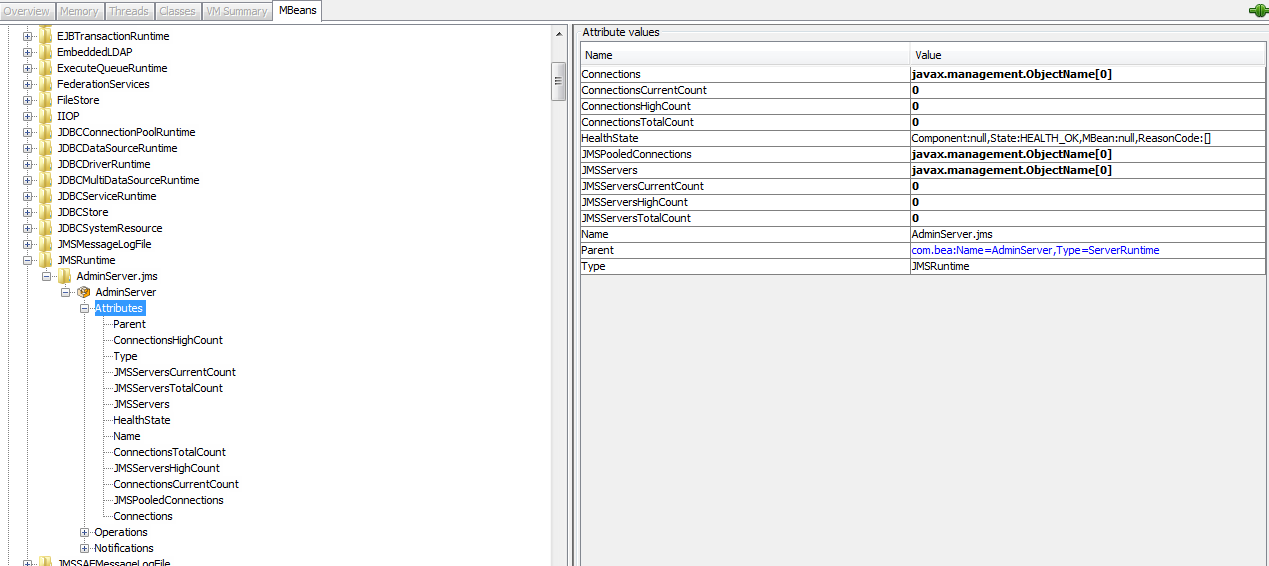
and this is the json
{
  "version": "1.01",
  "name": "custom.jmx.OSB",
  "type": "JMX",
  "processTypes":  [ 17 ],
  "entity": "PROCESS_GROUP_INSTANCE",
  "configUI" : {
    "displayName": "OSB JMX"
  },
  "metrics": [
    {
      "timeseries": {
        "key": "TX_count",
	    "unit": "Count",
        "dimensions": ["rx_pid"]
      },
      "source": {
        "domain": "com.bea",
        "keyProperties": {
          "type": "JMSRuntime",
		  "name": "AdminServer"
        },
        "attribute": "ConnectionsTotalCount",
        "calculateDelta": false,
        "calculateRate": false,
        "aggregation": "SUM"
      }
    }
  ],
  "ui":
  {
  "group" : "OSB metrics",
  "title" : "Matrix title",
  "series" : [
				{
				"key" : "TX_count",
				"aggregation" : "avg"
				}
			]

  }
}
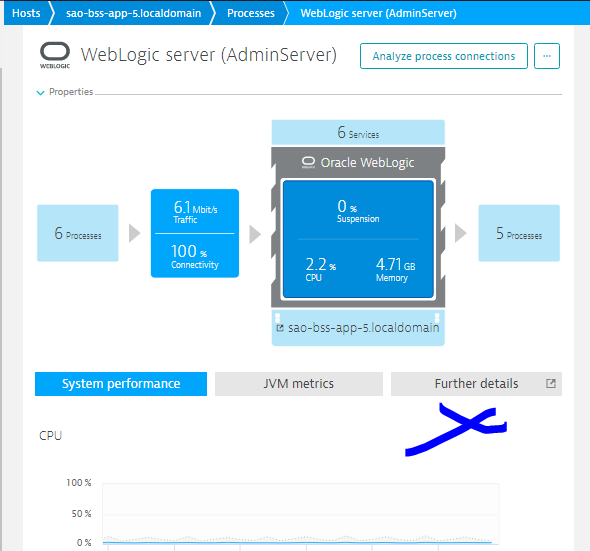
and the plugin is loaded OK

But still we can't see nothing under the process page as expected.

The question now is may be the plugin pull the data ok but just not showing it with in the DynaTrace Managed processes page. Is there something we are missing here that we need to do except than loading the plugin? is there a log file for the plugin operation to see if it pull data out of the processes or if there is just a problem to show the data it collected ?
Can you or someone help to explanation on how can we debug this issue?
Thanks again
Yos
dynatrace certificated professional - dynatrace master partner - Matrix Soft Ware Division - Israel
Options
- Mark as New
- Subscribe to RSS Feed
- Permalink
16 Oct 2017 11:55 AM
Your are defining a chart, not a key chart. Normal charts are located in the "Further details", see Plugin SDK.
Certified Dynatrace Master | Alanata a.s., Slovakia, Dynatrace Master Partner
Options
- Mark as New
- Subscribe to RSS Feed
- Permalink
16 Oct 2017 03:10 PM
Hi again
OK got that I have to adjust the UI part as described in th documentation
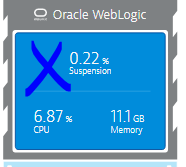
But still can't see any chart under Further details

And also when cahnge the UI to show keymetrics
{
  "version": "1.03",
  "name": "custom.jmx.OSB",
  "type": "JMX",
  "processTypes":  [ 17 ],
  "entity": "PROCESS_GROUP_INSTANCE",
  "configUI" : {
    "displayName": "OSB JMX"
  },
  "metrics": [
    {
      "timeseries": {
        "key": "ConnectionsTotalCount",
	    "unit": "Count",
        "dimensions": ["rx_pid"]
      },
      "source": {
        "domain": "com.bea",
        "keyProperties": {
          "type": "JMSRuntime",
		  "name": "AdminServer"
        },
        "attribute": "ConnectionsTotalCount",
        "calculateDelta": false,
        "calculateRate": false,
        "aggregation": "SUM"
      }
    }
  ],
  "ui":
  {
  "Keymetrics" : [
				{
				"key" : "ConnectionsTotalCount",
				"aggregation" : "avg",
				"mergeaggregation" : "sum",
                "displayname" : "ConnectionsTotalCount"
                }
                ],
                "keycharts" : [ ],
                "charts": [ ]
        }
}
Its not show data in the key as I was expecting 😞
pretty frustrating I would say ! but I will keep on trying tomorrow !
dynatrace certificated professional - dynatrace master partner - Matrix Soft Ware Division - Israel
Options
- Mark as New
- Subscribe to RSS Feed
- Permalink
17 Oct 2017 09:06 AM
Yes, debugging custom extensions in Dynatrace is a pain.
I would try to access the data using API to see if it's collecting or not. If you are not familiar with timeseries api, please setup access token first (see here)
Then you can use curl or any tool capable of sending HTTP GET/POST requests.
First do a list of available metrics to see if there is your metric: (Hostname in the URL is different for you, since you have dynatrace managed)
curl -H "Authorization: Api-Token <your_api_token>" "https://<environment_id>.live.dynatrace.com/api/v1/timeseries"
See if your defined metric is there, it should be named as custom.jmx.OSB:ConnectionsTotalCount
It's a good idea to format the output using jq tool and filter out just the custom JMX metrics:
curl -H "Authorization: Api-Token <your_api_token>" "https://<environment_id>.live.dynatrace.com/api/v1/timeseries"|jq '.[] | select (.timeseriesId |contains ("custom.jmx"))'
If you can't see your metrics, it's not registered. If you can see it, try to fetch data for all entities for the last hour:
curl -H "Authorization: Api-Token <your_api_token>" "https://<environment_id>.live.dynatrace.com/api/v1/timeseries?relativeTime=hour&aggregationType=AVG×eriesId=custom.jmx.OSB:CollectionsTotalCount"|jq '.'
However if you cannot see the data here, dynatrace is not collecting it for some reason.
Certified Dynatrace Master | Alanata a.s., Slovakia, Dynatrace Master Partner
Options
- Mark as New
- Subscribe to RSS Feed
- Permalink
17 Oct 2017 02:15 PM
Hi Julius,
We can see the timeseries with browser

But we can't get with the timeseriesid any data with

https:....api/v1/timeseries?Api-Token=xxxxxxxx&relativeTime=week&aggregationType=max×eriesId=custom.jmx.OSB:ConnectionsTotalCount
dynatrace certificated professional - dynatrace master partner - Matrix Soft Ware Division - Israel
Options
- Mark as New
- Subscribe to RSS Feed
- Permalink
17 Oct 2017 04:01 PM
Unfortunately it's not collected. I'd recommend to reach out to dynatrace support how to turn on debugging for JMX metrics collection.
Certified Dynatrace Master | Alanata a.s., Slovakia, Dynatrace Master Partner
Options
- Mark as New
- Subscribe to RSS Feed
- Permalink
17 Oct 2017 04:04 PM
Will do
and thanks a lot for your kind and patient help
Yos
dynatrace certificated professional - dynatrace master partner - Matrix Soft Ware Division - Israel
