- Dynatrace Community
- Dynatrace
- Extend
- Extensions
- Stored Procedures ID in MSSQL
- Subscribe to RSS Feed
- Mark Topic as New
- Mark Topic as Read
- Pin this Topic for Current User
- Printer Friendly Page
Stored Procedures ID in MSSQL
- Mark as New
- Subscribe to RSS Feed
- Permalink
21 Apr 2023
09:53 AM
- last edited on
17 May 2023
01:37 PM
by
![]() Michal_Gebacki
Michal_Gebacki
Hi all,
can someone suggest how to capture and display storedprocedure ID?
Thanks!
- Labels:
-
extensions
-
mssql
- Mark as New
- Subscribe to RSS Feed
- Permalink
12 May 2023 01:39 PM
Hello @Swati_Bhat ,
As we're waiting for help from the rest of the Community, you can check out these documentation articles, which explains how to manage your MSSQL extensions and how to get even more information by creating your own MSSQL extension.
- Mark as New
- Subscribe to RSS Feed
- Permalink
17 May 2023 02:49 PM
As this is in the extensions forum: Do you mean with the MSSQL extension (which currently doesn't capture stored procedures), or do you mean through the OneAgent deep monitoring? I'd expect the latter, but just want to make sure before moving the thread to the correct forum.
- Mark as New
- Subscribe to RSS Feed
- Permalink
01 Jun 2023 07:39 AM
Hello @Mike_L
We are using the Oracle Database Extension 1.1.3, but do not see the most time consuming Oracle statements. What could be the reason?
Regards,
Babar
- Mark as New
- Subscribe to RSS Feed
- Permalink
01 Jun 2023 07:50 AM - edited 01 Jun 2023 08:02 AM
There is a new feature set added called TopN, you need to enable that to get the top queries.
- Mark as New
- Subscribe to RSS Feed
- Permalink
01 Jun 2023 08:03 AM
And you are on logs v2 or grail? If so I’d have a look at the AG logs to look for a permission error or so.
- Mark as New
- Subscribe to RSS Feed
- Permalink
01 Jun 2023 08:08 AM
Hello @Mike_L
We are on Log v2. Normally, we are providing the following permissions:
- CREATE_SESSION
- SELECT_CATALOG_ROLE
Sure, I can check the AG logs as well.
Regards,
Babar
- Mark as New
- Subscribe to RSS Feed
- Permalink
08 Jun 2023 09:47 AM
Permission errors in the Oracle datasource extension logs.
- Mark as New
- Subscribe to RSS Feed
- Permalink
08 Jun 2023 11:29 AM
Hello @Mike_L
I did not find anything related to the permissions except the following WARN is appearing in the logs.
[c0ceabd8-545e-3465-a186-f0e9fae683bd][-8419178555432512324][198073][out][c0ceabd8-545e-3465-a186-f0e9fae683bd]2023-06-08 | 13:20:08.413 | pool-2-thread-2 | WARN | c.d.s.p.p.GroupPoller | While polling from endpoint XXXXX-scan:0000:ABCD, querying group 'Redo', some metrics were ignored because Database returned null value: [com.dynatrace.extension.sql-oracle.memory.sga.redoBuffer.redoLogSpaceWaitTime, com.dynatrace.extension.sql-oracle.memory.sga.redoBuffer.redoSizeIncrease, com.dynatrace.extension.sql-oracle.memory.sga.redoBuffer.redoWriteTime, com.dynatrace.extension.sql-oracle.memory.physicalReads, com.dynatrace.extension.sql-oracle.memory.physicalReadsDirect, com.dynatrace.extension.sql-oracle.memory.memorySorts, com.dynatrace.extension.sql-oracle.memory.diskSorts]Regards,
Babar
- Mark as New
- Subscribe to RSS Feed
- Permalink
08 Jun 2023 02:24 PM
Download the latest version of the extension from the public hub, open the yaml and grab the query related to TopN. If you execute that manually as the configured user, do you get data?
- Mark as New
- Subscribe to RSS Feed
- Permalink
14 Jun 2023 12:23 PM
Hello @Mike_L
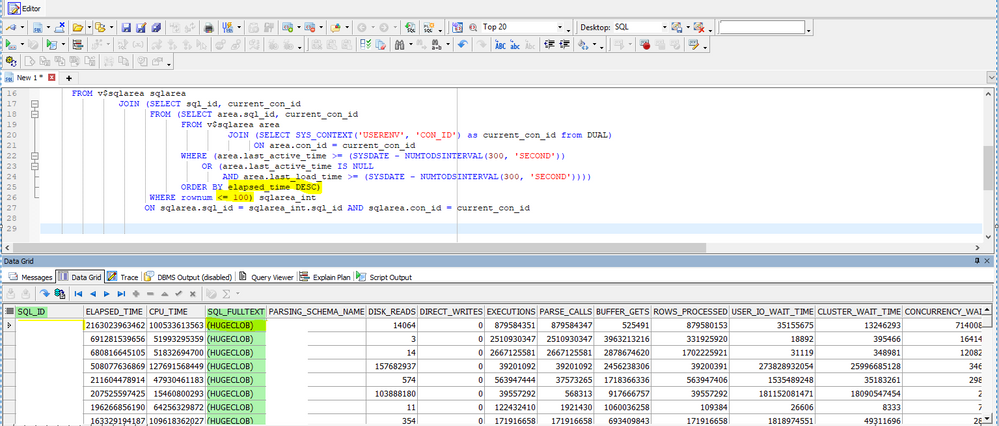
The query is providing SQL_ID and SQL_FULL TEXT but in the Dynatrace we do not see any Oracle statements. The following screenshots are for your reference.
Regards,
Babar
- Mark as New
- Subscribe to RSS Feed
- Permalink
14 Jun 2023 05:26 PM
Please create a support ticket.
- Mark as New
- Subscribe to RSS Feed
- Permalink
19 Jul 2023 03:19 PM
Hello @Mike_L
A quick update on the issue discussed with you.
There was a rule applied to drop the info log, so after modifying the rule, TopN statements start capturing.
Regards,
Babar


