- Dynatrace Community
- Ask
- Extensions
- Re: Windows Scheduled Tasks Extension: Plugin metrics
- Subscribe to RSS Feed
- Mark Topic as New
- Mark Topic as Read
- Pin this Topic for Current User
- Printer Friendly Page
- Mark as New
- Subscribe to RSS Feed
- Permalink
22 May 2023
07:53 AM
- last edited on
12 Jun 2023
03:13 PM
by
![]() Ana_Kuzmenchuk
Ana_Kuzmenchuk
We have installed the Windows Scheduled Task extension for the client, however the Host Classic Page and new page are different.
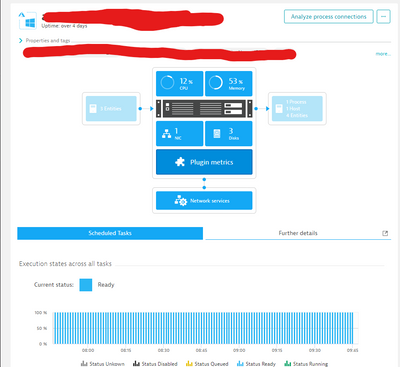
In the Classic page we can see the plugin metrics (screenshot 1):
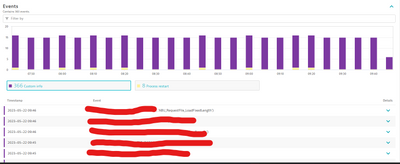
But I could not find this in the new Host page, what I could find is the Custom info events in the new page (screenshot 2):
Is Plugin metrics available in the new page, if so where and if not, will it be added?
Solved! Go to Solution.
- Labels:
-
extensions
-
metrics
- Mark as New
- Subscribe to RSS Feed
- Permalink
12 Jun 2023 03:18 PM
Hello @Ahmed_Khaled, were you able to clarify that on your own?
If you did, I think other Community members would be grateful if you shared the answer with them as well 😉
- Mark as New
- Subscribe to RSS Feed
- Permalink
12 Jun 2023 04:57 PM
Currently, the metrics coming from this extension cannot be visualized directly on the new Host page. This will be possible once the extension is updated to the new Extension Framework 2.0 (hopefully in July 2023).
However, the metrics can still be visualized and utilized in all other areas of the platform as usual. Find the metrics in the main "Metrics" menu by searching for "ext:tech:tasks". From here you can start building visualizations using the Data Explorer.
- Mark as New
- Subscribe to RSS Feed
- Permalink
16 Jun 2023 09:01 AM
Hi @Ana_Kuzmenchuk unfortunately I was not able to clarify that, as @Radu mentioned with the new Extension framework, I have already created a dashboard with the details to visualize the tasks
Featured Posts


