- Dynatrace Community
- Ask
- Open Q&A
- Re: Analyze process connections: when is it available or not?
- Subscribe to RSS Feed
- Mark Topic as New
- Mark Topic as Read
- Pin this Topic for Current User
- Printer Friendly Page
- Mark as New
- Subscribe to RSS Feed
- Permalink
19 Jul 2018
06:55 AM
- last edited on
03 Mar 2023
06:39 PM
by
![]() Karolina_Linda
Karolina_Linda
Hi,
When I went to the view of a process from "Hosts > [host name] > Processes > [process name] ", I found that there are two types of processes.
Some processes have the "Analyze process connection" view and the others don't.
Here is the example.
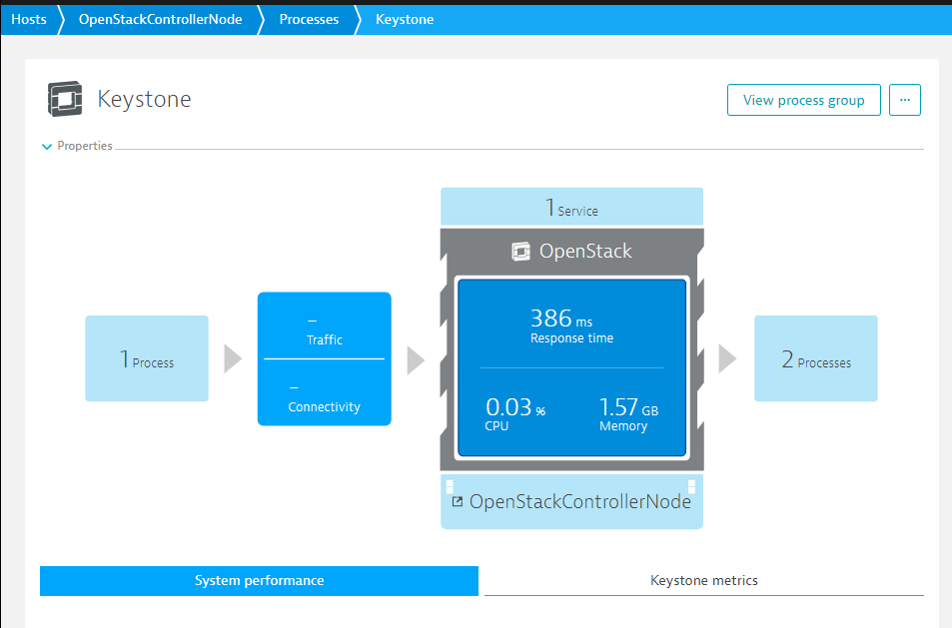
- Available "Analyze process connection"
- NOT Available "Analyze process connection"

Then, what is the difference between the former and the latter?
At first, when I saw the view of another process, I think that this difference is caused by whether this process is called by other processes or not, or whether this process calls other processes or not.
However, these examples show the different result from what I expected, so I don't have any ideas on this difference.
I'd like to know the necessary condition for "Analyze process connection".
Regards,
Kohei Saito
Solved! Go to Solution.
- Labels:
-
processes
- Mark as New
- Subscribe to RSS Feed
- Permalink
07 Sep 2018 09:51 AM
this is really good question. I have no clue when it visible and then is not
- Mark as New
- Subscribe to RSS Feed
- Permalink
27 Sep 2018 11:49 AM
Hi, I'm not really sure as I couldn't test it with my host data but probably it depends on traffic and connectivity info, as you can see in the image, the one without "Analyze process connection" button hasn't any traffic information, probably if there isn't any connection there's no info to analyze.
- Mark as New
- Subscribe to RSS Feed
- Permalink
13 Nov 2018 07:48 AM
Hi, i think that this button available for process, when monitored process calls another monitored process. This information, as i suggest, enriched by Network monitoring OneAgent component.
From my practice i have "Analyze process connections" if we install OneAgent not only on Application servers, for example also we install OneAgent on database server for infrastructure monitoring. I have "Analyze process connections" button in such environments.
Regards,
Alexander
- Mark as New
- Subscribe to RSS Feed
- Permalink
13 Nov 2018 11:34 AM
I always assumed you get this option if the process calls other processes on different hosts that are also instrumented.
Featured Posts
