- Dynatrace Community
- Dynatrace
- Ask
- Open Q&A
- Re: Apache worker processes RAM usage
- Subscribe to RSS Feed
- Mark Topic as New
- Mark Topic as Read
- Pin this Topic for Current User
- Printer Friendly Page
Apache worker processes RAM usage
- Mark as New
- Subscribe to RSS Feed
- Permalink
01 Jul 2021
10:33 AM
- last edited on
16 Nov 2021
10:39 AM
by
![]() MaciejNeumann
MaciejNeumann
Hi Everyone,
Recently we were troubleshooting an out-of-memory problem on a Apache web server triggering oom-killer. From syslog it was obvious that the main culprit was Apache - it had the maximum amount of workers running, each taking up a small amount of RAM.
We could see the number of busy workers rising in Dynatrace, but the memory consumption was attributed to "other processes", while the main Apache process with PHP used only around 110MB.
Is there any way to consolidate this, i.e. show the sum of memory and CPU utilization of all httpd processes instead of only one?
Davorin
- Labels:
-
apache
- Mark as New
- Subscribe to RSS Feed
- Permalink
11 Aug 2021 09:44 PM
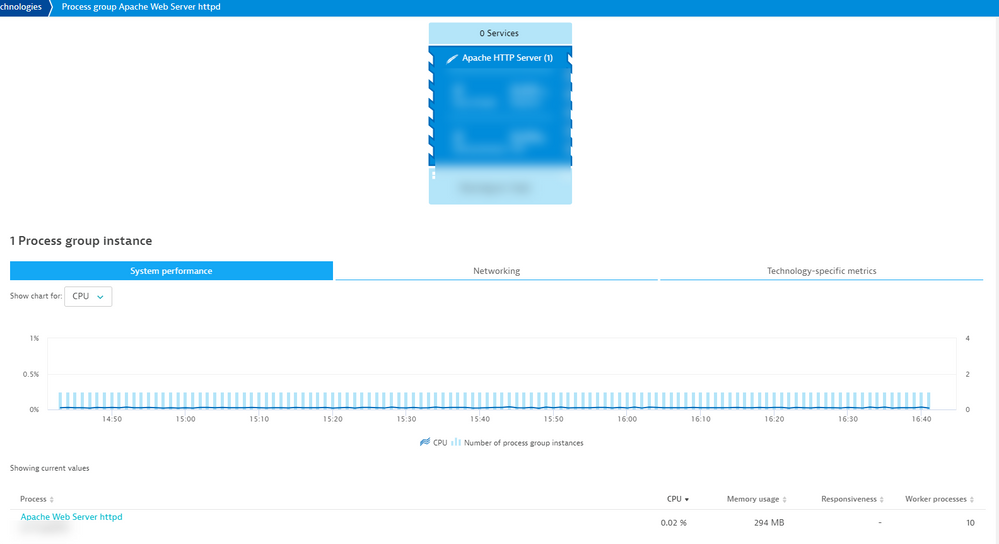
Do you want to see the consolidated metrics via the host? you should see that from the process chart on the host. Or you can narrow it down by technology and it will show the metrics collectively:
- Mark as New
- Subscribe to RSS Feed
- Permalink
12 Aug 2021 09:52 AM
Hi Chad,
The problem is that only a single Apache process is shown (httpd) in Dynatrace, whereas the worker processes get categorized under "other processes".
In most of the cases this is fine, but in this specific case a misconfiguration of Apache lead to worker processes consuming all memory on the host. We had ~1000 worker processes all consuming ~14 MB of RAM, which was enough to eat up all the RAM and swap. Since the processes are considered 'not important' as singletons (<5% CPU, RAM and network traffic per process), Dynatrace didn't show them. The only indication of what really happened was in syslog.

