- Dynatrace Community
- Dynatrace
- Ask
- Open Q&A
- Be notified of increased SQL statement costs
- Subscribe to RSS Feed
- Mark Topic as New
- Mark Topic as Read
- Pin this Topic for Current User
- Printer Friendly Page
Be notified of increased SQL statement costs
- Mark as New
- Subscribe to RSS Feed
- Permalink
21 Apr 2023 08:09 AM
Dears All,
How to configure and be notified of the increased SQL statement costs?
Regards,
Babar
- Labels:
-
databases
- Mark as New
- Subscribe to RSS Feed
- Permalink
21 Apr 2023 07:33 PM
If you are talking about Oracle's statement plans cost, I believe it is not available for the moment.
But, it this SQL cost varies significantly, it does impact the timings that Dynatrace detects, and you will be alerted when it varies significantly, also.
- Mark as New
- Subscribe to RSS Feed
- Permalink
22 Apr 2023 11:02 AM
That part of the documentation is not about the costs I was thinking of 🤔
- Mark as New
- Subscribe to RSS Feed
- Permalink
22 Apr 2023 11:15 AM
- Mark as New
- Subscribe to RSS Feed
- Permalink
22 Apr 2023 12:19 PM
Hello @AntonioSousa
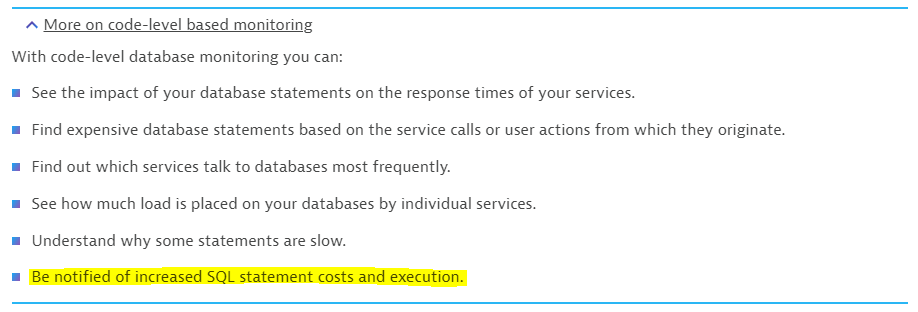
Exactly. I am looking for the same. Is the following highlighted point telling something else/ or was I misunderstood?
Regards,
Babar
- Mark as New
- Subscribe to RSS Feed
- Permalink
22 Apr 2023 12:46 PM
Pretty sure it's not directly related to the Cost column in Oracle statement plans.
I believe that the point refers to the fact that we can be alerted when the SQL statements start consuming more time/resources, and in a certain way, reflects the Costs referenced by the statement plans, although not the same in terms of metric.
- Mark as New
- Subscribe to RSS Feed
- Permalink
22 Apr 2023 12:57 PM
Hello @AntonioSousa
Thank you. Do you think that such type of a metric can be provided by Dynatrace? Will this enhance the insight of the database (as the execution metric is already available)?
Regards,
Babar
- Mark as New
- Subscribe to RSS Feed
- Permalink
22 Apr 2023 04:31 PM
I believe it could, but given the number of queries, I believe it might have an impact on overhead on the database itself.
- Mark as New
- Subscribe to RSS Feed
- Permalink
23 Apr 2023 09:43 AM
Hello @AntonioSousa
Thank you for your opinion. In this case, the metrics can be available on-demand bases, as we have a SQL bind value. I am doing this brainstorming with you because recently we have seen a wearied behavior of the stress testing in the UAT environment where nothing was clear until a DBA disclosed that there is a query performing a full table scan plus a high cost and without any index. So he had to create an index to enhance the query performance.
The new execution plan cost was reduced from 106 to 3. Therefore, if we can have such types of observations from the monitoring perspective instead of relying on DBAs.
Regards,
Babar


