This website uses Cookies. Click Accept to agree to our website's cookie use as described in our Privacy Policy. Click Preferences to customize your cookie settings.
Open Q&A
If there's no good subforum for your question - ask it here!
Turn on suggestions
Auto-suggest helps you quickly narrow down your search results by suggesting possible matches as you type.
- Dynatrace Community
- Ask
- Open Q&A
- Re: Capture Request Body of a POST request in Dynatrace
Options
- Subscribe to RSS Feed
- Mark Topic as New
- Mark Topic as Read
- Pin this Topic for Current User
- Printer Friendly Page
Options
- Mark as New
- Subscribe to RSS Feed
- Permalink
28 Feb 2022
05:44 PM
- last edited on
09 Dec 2025
10:00 AM
by
![]() IzabelaRokita
IzabelaRokita
Summary: Dynatrace can capture POST request bodies for deeper insight into transactions and API calls. This thread explains configuration steps, privacy considerations, and best practices for analysing request payloads securely.
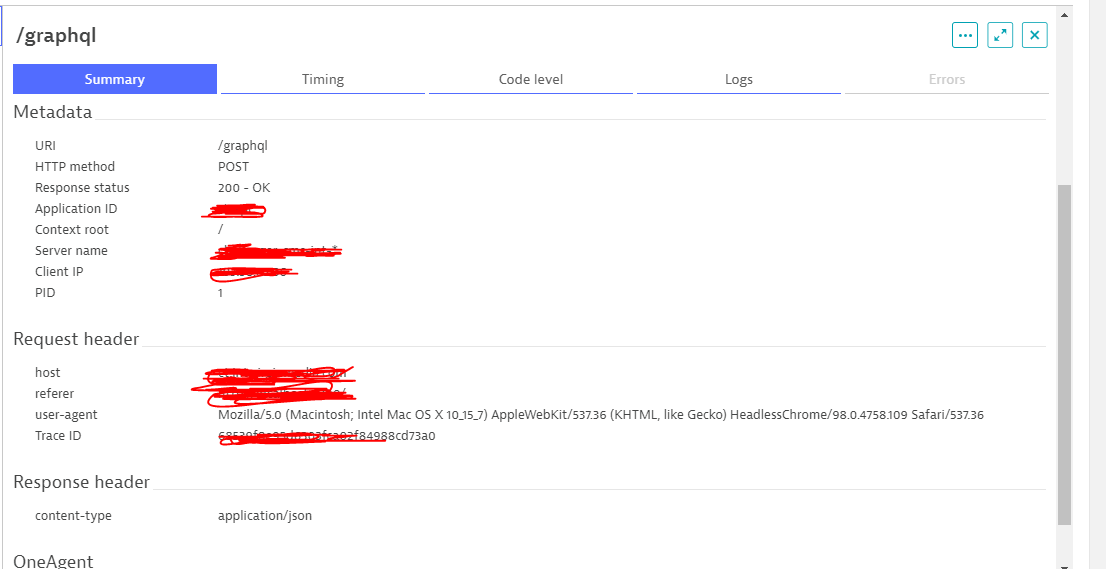
Hi, I've a service monitored in Dynatrace and our front end makes a POST call to that service using an endpoint '/graphql' and sends a Payload/Body.
I am trying to find some performance issues with my service, but the investigation is not leading anywhere unless we capture what is being sent in the request.
Is there a way to capture the payload in Purepath or elsewhere in Dynatrace to see what is being sent in the request? It would be ideal to understand which specific requests are affecting the application's performance.
If I inspect the browser of my application, the payload appears as follows (it's a JSON body) - screenshot-1.
BUT if I look at Dynatrac,e it just shows like this - screenshot-2
Solved! Go to Solution.
Labels:
screenshot-1.PNG
16 KB
screenshot-2.PNG
29 KB
Reply
3 REPLIES 3
Options
- Mark as New
- Subscribe to RSS Feed
- Permalink
28 Feb 2022 06:16 PM
This is not currently possible. There is a RFE for capturing the POST body.
https://community.dynatrace.com/t5/Dynatrace-product-ideas/RFE-capture-POST-Bodies/idi-p/150484
Options
- Mark as New
- Subscribe to RSS Feed
- Permalink
07 Mar 2022 03:24 PM
We have never captured the body of a request, due to both resource consumption and security concerns. The workaround that I have explored for this is to find a method that exposes the same information and access it through a request attribute.
Options
- Mark as New
- Subscribe to RSS Feed
- Permalink
04 Apr 2023 07:43 AM
Hi,
You may want to investigate business events to solve your use case
Blog:
https://www.dynatrace.com/news/blog/the-value-of-business-events-how-it-can-increase-business-agilit...
Observability clinic
https://www.youtube.com/watch?v=a5Kp3WJ8NHU&list=RDCMUCcYJ-5q_AfmjQ4XTjTS0o3g&index=4
FYI: @DanielMarschnig

What are #Dynatrace Business Events? How to capture business events? What are the Business Analytics Use Cases that Dynatrace Business Events enable? Watch this Observability Clinic, where Klaus Enzenhofer, Principal Product Manager at Dynatrace, walks us through an end-2-end example of ingesting
Featured Posts
