This website uses Cookies. Click Accept to agree to our website's cookie use as described in our Privacy Policy. Click Preferences to customize your cookie settings.
Open Q&A
If there's no good subforum for your question - ask it here!
Turn on suggestions
Auto-suggest helps you quickly narrow down your search results by suggesting possible matches as you type.
- Community Home
- Platform
- Open Q&A
- Re: Code Level Visibility
Options
- Subscribe to RSS Feed
- Mark Topic as New
- Mark Topic as Read
- Pin this Topic for Current User
- Printer Friendly Page
Options
- Mark as New
- Subscribe to RSS Feed
- Permalink
02 Jul 2017 05:15 PM
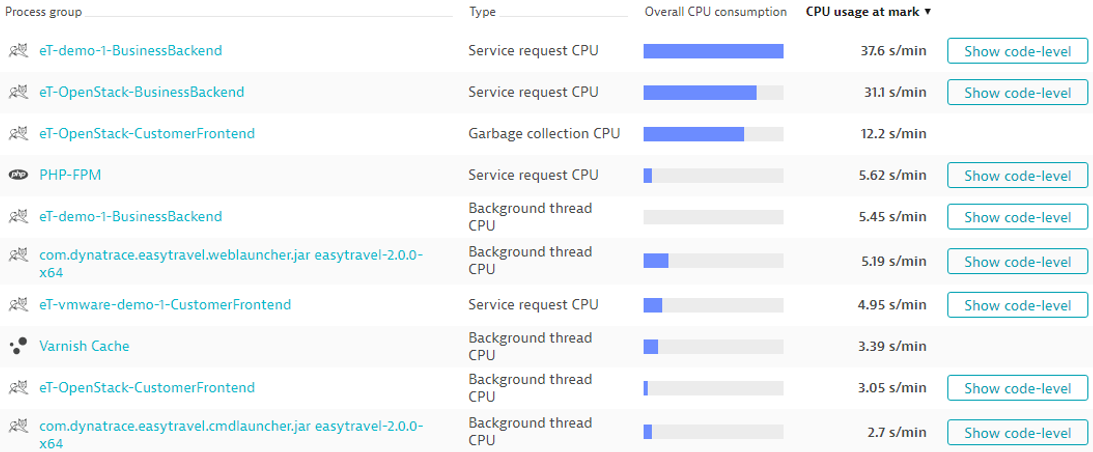
When I go to CPU Profiler (code-level), why does some have 'show code-level' while some don't?
Solved! Go to Solution.
Labels:
- Labels:
-
process groups
1 REPLY 1
Options
- Mark as New
- Subscribe to RSS Feed
- Permalink
03 Jul 2017 07:51 AM
Hi Wai,
We currently only have Always on profiling for Java and .NET. In the picture you have also a Varnish for which we do not have code level visibility.
The other is "garbage collection", there is no java code involved there, we just track the cpu it consumes.
On PHP and Node.js we have code level visibility into the services but not in background threads yet, although we are working on this.
Best
Mike
Reply
Featured Posts
