- Dynatrace Community
- Ask
- Open Q&A
- Dashboard Clickable Tiles
- Subscribe to RSS Feed
- Mark Topic as New
- Mark Topic as Read
- Pin this Topic for Current User
- Printer Friendly Page
- Mark as New
- Subscribe to RSS Feed
- Permalink
25 Jan 2022
02:39 PM
- last edited on
26 Jan 2022
11:01 AM
by
![]() MaciejNeumann
MaciejNeumann
Dears,
It seems the clickable feature was revoked or I am the one facing this situation?
The feature was very useful in a situation when you have multiple small tiles with several processes/services to enlarge on-demand basis to have a closer look.
Regards,
Babar
Solved! Go to Solution.
- Labels:
-
dashboards classic
- Mark as New
- Subscribe to RSS Feed
- Permalink
30 Mar 2022 06:30 PM
@Babar_Qayyum you are right, the one click functionality was dropped in that cluster update. So now you have a two step to check out the details.
- Mark as New
- Subscribe to RSS Feed
- Permalink
30 Mar 2022 06:50 PM
Hi @Babar_Qayyum
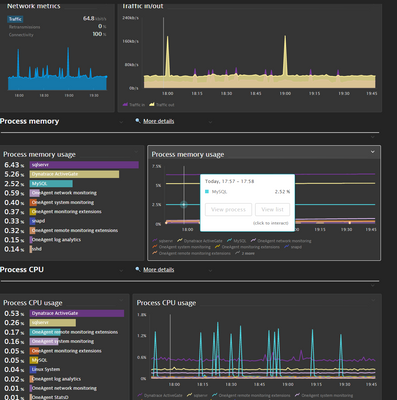
the dashboards are indeed going through big improvements and as you can see from the screenshot below you are still able to access e.g. the processes from the tile directly, and the timeline(vertical white line) will follow you across all graph tiles in the same dashboard !
However from views like the Top list for now you are not able to jump directly into the entities being shown (probably a feature that will come in the future)
I would advise combining tiles with different views to get the most out of it.
As another example the new honeycomb tile provides a nice overview where you can also set custom thresholds for the desired metric
- Mark as New
- Subscribe to RSS Feed
- Permalink
31 Mar 2022 07:58 AM
Hello @mark_bley
Thank you for your comments but still, it is not what we are supposed to have (example of the first screenshot) and the users are used to. Recently, one of the top management people called me and asked what is wrong with you people that on every upgrade you surprise us and that was particular due to this.
Regards,
Babar
- Mark as New
- Subscribe to RSS Feed
- Permalink
07 Jul 2025 11:06 AM - edited 07 Jul 2025 11:07 AM
@ChadTurner
Do we have any chance to have the same in the new DQL dashboards?
Looks like discovered entities are not recognised by Dynatrace.
And even clickable links are not possible since Dynatrace is not using URL parameters anymore e.g.: /ui/apps/dynatrace.davis.problems/ no parameters like problem id
Featured Posts


