- Dynatrace Community
- Ask
- Open Q&A
- Determine which incoming connection is using the most bandwidth
- Subscribe to RSS Feed
- Mark Topic as New
- Mark Topic as Read
- Pin this Topic for Current User
- Printer Friendly Page
- Mark as New
- Subscribe to RSS Feed
- Permalink
12 Apr 2023
11:05 PM
- last edited on
13 Apr 2023
07:42 AM
by
![]() MaciejNeumann
MaciejNeumann
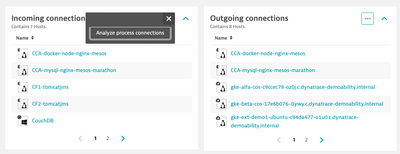
When viewing a host I can see all incoming connections, but I have no way to rank these. Is there a way to show which incoming connections are using the most bandwidth, or at least which incoming connections are the most active based on number of connections of time period (e.g. last 2 hours).
Thanks!
Solved! Go to Solution.
- Labels:
-
network monitoring
- Mark as New
- Subscribe to RSS Feed
- Permalink
13 Apr 2023 09:49 AM - edited 13 Apr 2023 09:49 AM
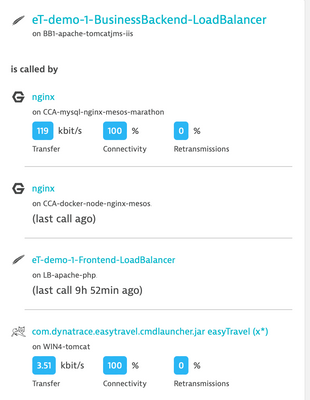
You can go Analyze Process Connection and see in the details Transfer for each connection.
You can also select the appropriate metrics on Data Explorer and do splitting by host or application process.
https://www.dynatrace.com/support/help/observe-and-explore/explorer
Radek
Featured Posts


