- Dynatrace Community
- Ask
- Open Q&A
- Re: Dimension error for metric events
- Subscribe to RSS Feed
- Mark Topic as New
- Mark Topic as Read
- Pin this Topic for Current User
- Printer Friendly Page
- Mark as New
- Subscribe to RSS Feed
- Permalink
14 May 2023 05:21 PM
Hello Folks,
While configuring metric events, we usually face the dimension warning (limit of 1000 dimensions)
My first question is, what does dimension means?
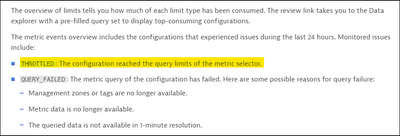
Most of the time, we ignore this warning and save the metric however, we see THROTTLED warning for such metric.
What will happened in this case, will alert still triggered?
And what does THROTTLED means?
Regards,
AK
Solved! Go to Solution.
- Labels:
-
metrics
- Mark as New
- Subscribe to RSS Feed
- Permalink
15 May 2023 12:04 AM - edited 15 May 2023 11:42 AM
Hi @AK ,
the dimension is basically the object inside Dynatrace to which metrics are reffered (and on which you'll be able to apply the configuration.)
As a basic example: the metric cpu consumption (%) is referred to the dimension HOST (which is one of the many CI mapped inside Dynatrace).
You should definetly read more about it here: it will help you also for advance stuff when you play with data explorer and API.
For the throttled logical status the Dynatrace documentation states the following "You can monitor all metric dimensions within one configuration (for example, it is possible to create an alert for 20,000 CPUs in a single metric event configuration). As a safeguard, Dynatrace throttles these configurations with a limit of 100 simultaneous alerts. You can narrow down the scope of the event to particular dimensions."
Click the link here to see it for yourself and explore more.
Hope I've helped,
Yann
- Mark as New
- Subscribe to RSS Feed
- Permalink
15 May 2023 08:01 AM
Hi,
You have more details here.
I would suggest to be more specific using metric selector, or split metric event in more than one metric event.
Best regards
- Mark as New
- Subscribe to RSS Feed
- Permalink
15 May 2023 02:19 PM
Hello,
We have the same problem. Dynatrace still complains even if I use the very specific metric selector that results in 50-100 results.
For example:
- we have Temperature metric
- we have 1200 devices (probes) that report temperature
- devices are located in 12 rooms (room name is Temperature metric dimension)
So in this example we have 100 devices in 1 room.
I have specified very specific metric selector to calculate room average temperatue that uses room as filter: filter(eq("room","ABC"), that displays only 100 devices in ABC room.
But Dynatrace still displays: The number of metric dimension values in the last 24 hours (1200) exceeds the limit of 1000.
It looks like the limit is for ALL dimensions for specific metric and metric selector will not help to remove throttling.
Can someone from Dynatrace explain what this sentence exactly mean: As a safeguard, Dynatrace throttles these configurations with a limit of 100 simultaneous alerts.
What alert means in this sentence? Does it mean that it will create only max 100 problems and will stop creating new problems until the count will go back under 100?
How to create proper metric rule to create problem every time when room average temperature is above X value?
- Mark as New
- Subscribe to RSS Feed
- Permalink
30 May 2023 08:37 PM
I think you have to provide a small :limit on the metrics selector.
- Mark as New
- Subscribe to RSS Feed
- Permalink
16 Oct 2023 03:39 PM
Hi mariusz
sorry for revive this but i am facing the same here. did you get some solution about this ? set a limit really works ?
Featured Posts

