This website uses Cookies. Click Accept to agree to our website's cookie use as described in our Privacy Policy. Click Preferences to customize your cookie settings.
Open Q&A
If there's no good subforum for your question - ask it here!
Turn on suggestions
Auto-suggest helps you quickly narrow down your search results by suggesting possible matches as you type.
- Community Home
- Platform
- Open Q&A
- Dynatrace - Method hotspots Tools - What is the unit ?
Options
- Subscribe to RSS Feed
- Mark Topic as New
- Mark Topic as Read
- Pin this Topic for Current User
- Printer Friendly Page
Options
- Mark as New
- Subscribe to RSS Feed
- Permalink
07 Nov 2018
10:30 AM
- last edited on
10 Dec 2021
06:07 AM
by
![]() MaciejNeumann
MaciejNeumann
Hello !
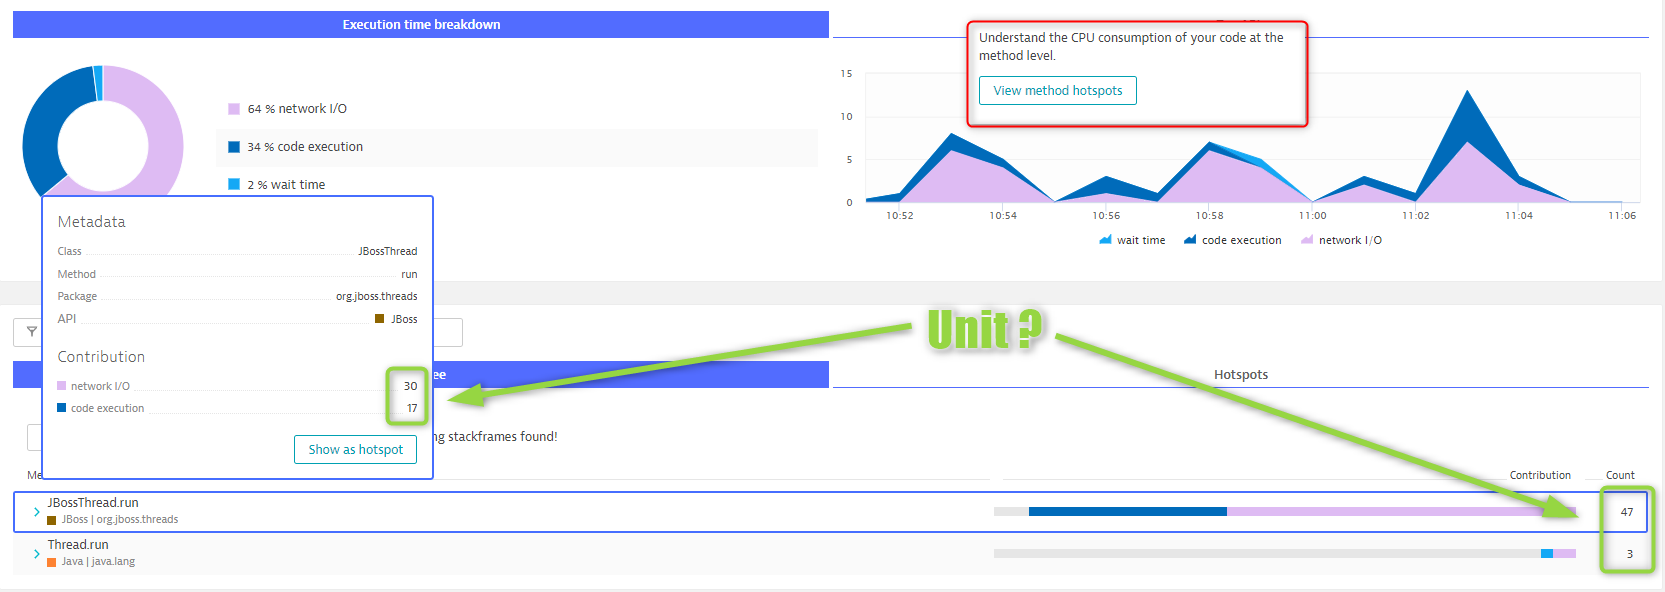
May be someone could help me : i don't understand what is the unit used with Method Hotspots ? I want use this tools to understand the cpu consummation as indicated but i only see contribrution and i don't found this information in documentation ..
I join a screenshot to show metrics which i need unit information.
Thanks!
Solved! Go to Solution.
Labels:
- Labels:
-
java
-
profiling and optimization
Reply
10 REPLIES 10
Options
- Mark as New
- Subscribe to RSS Feed
- Permalink
07 Nov 2018 10:53 AM
This number represents samples count. During all transactions dynatrace is sampling cpu. Amount of samples is also representation of time spend on those methods because samples are making in regular timeframes.
Regards, Sebastian
Options
- Mark as New
- Subscribe to RSS Feed
- Permalink
07 Nov 2018 11:13 AM
Thanks Sebastian for your answer!
So sum up, if i understand your explaination : this number represent the time spent on CPU ?
Options
- Mark as New
- Subscribe to RSS Feed
- Permalink
07 Nov 2018 11:53 AM
Not directly, It doesn't mean number of ms spent on CPU. It means that when CPU is sampled in 10ms steps, this amount of samples has been recorded.
Regards, Sebastian
Options
- Mark as New
- Subscribe to RSS Feed
- Permalink
07 Nov 2018 12:03 PM
If I want to see Method Hotspots for a single purepath, does it mean Count = Method execution time or such methods exists in specified CPU samples?
Options
- Mark as New
- Subscribe to RSS Feed
- Permalink
07 Nov 2018 12:20 PM
It means that this method exists in X number of samples. It also means that method with higher number of samples was present on CPU longer. But you have to understand. CPU sampling is making in 10ms time periods. This means that short execution method can be missed. This also means that dynatrace doesn't know exactly how long execution taken (because we don't know if first sample was in exact place of starting execution time etc).
Regards, Sebastian
Options
- Mark as New
- Subscribe to RSS Feed
- Permalink
07 Nov 2018 12:30 PM
Thanks for your answer Sebastian : this metric is more clear for me. The CPU sampling with 10ms time is documentated somewhere ?
Options
- Mark as New
- Subscribe to RSS Feed
- Permalink
07 Nov 2018 01:16 PM
Actually this is information I use based on Appmon history. There CPU sampling from autosensor was fired in 10 ms periods. Actually I don't see documentation for method hotspots anyware in dynatrace documentation.
Regards, Sebastian
Options
- Mark as New
- Subscribe to RSS Feed
- Permalink
07 Nov 2018 01:21 PM
Ok my bad I've made mistake. When you are anylizng single pure path there you will see number which is representation of contribution of response time. So it's not samples from cpu sampling. I think they are representing numerical representation of percentage of response time contribution.
Samples I was talking about are when you will go to whole service, and from this point of view you will try to analyze cpu consumption. Sorry for mistake 🙂
Regards, Sebastian
Options
- Mark as New
- Subscribe to RSS Feed
- Permalink
07 Nov 2018 03:47 PM
Thanks Sebastian! I have opened a ticket to the support, may be they can help us to clarify this point.
Options
- Mark as New
- Subscribe to RSS Feed
- Permalink
07 Nov 2018 09:35 PM
Please post the feedback. I'm interesting in this topic as well
Featured Posts
