- Dynatrace Community
- Ask
- Open Q&A
- How is CPU saturation really calculated?
- Subscribe to RSS Feed
- Mark Topic as New
- Mark Topic as Read
- Pin this Topic for Current User
- Printer Friendly Page
- Mark as New
- Subscribe to RSS Feed
- Permalink
23 Aug 2023 08:19 PM
The documentation says:
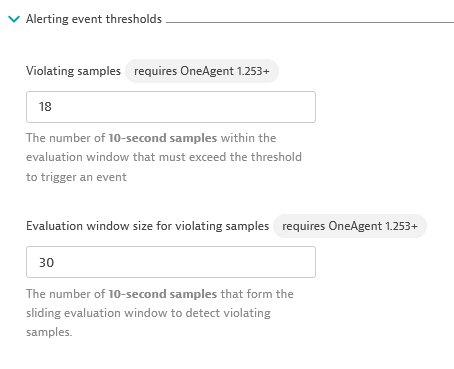
By default, Dynatrace alerts when average CPU usage is higher than 95% in 3 of 5 consecutive one-minute intervals or when usage is higher than 90% in a single five-minute interval.But, when we look at how we define custom settings for the CPU saturation settings, it seems to be based on the 10-second samples that are taken each minute:
Now, even though the two approaches might seem similar, there are cases where it will not happen. Given that we don't have visibility into the 10-second samples (we do have the min/avg/max values), how do we know what is exactly happening with CPU saturation detection?
BTW, remembers me of this Product Idea: https://community.dynatrace.com/t5/Product-ideas/RFE-Increase-resolution-of-data/idi-p/166920
Solved! Go to Solution.
- Labels:
-
cpu
-
infrastructure monitoring
- Mark as New
- Subscribe to RSS Feed
- Permalink
06 Sep 2023 10:44 PM
Hi,
What documentation exactly are you looking at? The documentation here discusses event thresholds using 10 second intervals. I believe 10 second intervals are used for infra alerting, and one minute intervals are used for graphing. If you provide me the documentation where it says that, I can get clarification from product team and get updated appropriately.
Regards,
Bradley
- Mark as New
- Subscribe to RSS Feed
- Permalink
06 Sep 2023 11:01 PM
The reference from documentation is here: https://www.dynatrace.com/support/help/platform/davis-ai/basics/events/event-types/resource-events
- Mark as New
- Subscribe to RSS Feed
- Permalink
06 Sep 2023 11:18 PM
Thanks. I've reached out to confirm and will let you know once I have more information.
Regards,
Bradley
- Mark as New
- Subscribe to RSS Feed
- Permalink
08 Sep 2023 03:03 PM
Hi Antonio,
I've confirmed that the documentation you shared should be changed. The CPU alerting now uses 10 second intervals. Thank you for bringing this to our attention.
Regards,
Bradley
Featured Posts

