- Dynatrace Community
- Ask
- Open Q&A
- Re: How often does OneAgent report data to a metric?
- Subscribe to RSS Feed
- Mark Topic as New
- Mark Topic as Read
- Pin this Topic for Current User
- Printer Friendly Page
- Mark as New
- Subscribe to RSS Feed
- Permalink
20 Mar 2024 12:26 PM
Hi Everyone,
I have a use case where I need to increase the sensitivity of a metric event to create a problem card within seconds after it sees the anomaly. In the Advance Modal properties, I can set to 1 for violating samples and that is the highest I can set not less than that. This means problem will be created only if anomaly is seen for 1 minute continuously. So hence, I am wondering is this the maximum sensitivity we can set on is there any way we can reduce the same?
Your ideas are appreciated.
Solved! Go to Solution.
- Labels:
-
dynatrace managed
-
metrics
-
problems classic
- Mark as New
- Subscribe to RSS Feed
- Permalink
20 Mar 2024 12:45 PM
This would be dependent on the metric. For example if it is a metric(s) from an extension/plugin that is only querying every 1,5,10,15 mins etc, then you are subject to that Query Frequency.
If this is an Out Of The Box metric, then you are correct in the fact that the metric alerting sample will be at minimum 1 in the sliding window of up to 60 Mins.
- Mark as New
- Subscribe to RSS Feed
- Permalink
20 Mar 2024 02:01 PM
Thanks, Chad. That answered my question.
- Mark as New
- Subscribe to RSS Feed
- Permalink
20 Mar 2024 07:23 PM
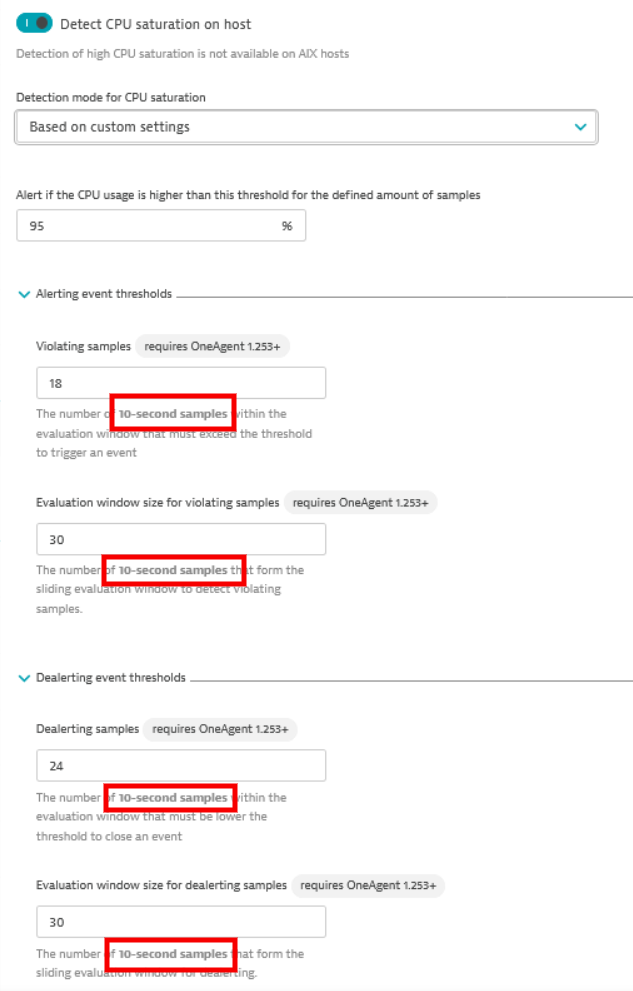
There has been some evolution recently. As can be seen in the configuration itself, for instance for CPU resource usage at the host level, it's not 1 minute anymore, but 10 seconds. Not well documented yet, but clearly visible:
- Mark as New
- Subscribe to RSS Feed
- Permalink
21 Mar 2024 02:14 AM
Hi @AntonioSousa
This sampling duration happens only for the entity based anomaly detection settings not for metric events. For metric events, we still have the minimum of 1 min because builtin metrics values are reported to Dynatrace on every minute granularity. In services and user actions samples decreased to 30-seconds as well.
- Mark as New
- Subscribe to RSS Feed
- Permalink
21 Mar 2024 11:10 AM
That is exactly right, and even if the system is sampling the data at a 10-30 second frequency, the custom metric event will take that as an aggregate and then alert on it in a 1 min sampling. So say CPU, collected every 10 seconds.... 08:00:00 =20%, 08:00:10 =90%, 08:00:20 =10%, but if you are in the data explorer or using the metric selector, you can select the MAX value at the given time which in his case is 90% at 08:00:10, but you have to still wait for that 1 Min to elapse.
- Mark as New
- Subscribe to RSS Feed
- Permalink
21 Oct 2024 01:33 PM
Hello,
what about the metrics from "Anomaly detection" for the Oracle database extension?
We need to know how to check/see the frequency for every metric from the Oracle database extension. Does a metric for tablespace run on every 1 minute or on every 5 minutes? and etc. - for EVERY metric
One more thing in every metric there we could only configure
BUT what about the evaluation window for de-alerting ?
Featured Posts


