- Dynatrace Community
- Dynatrace
- Ask
- Open Q&A
- Re: IIS Worker Process Pool
- Subscribe to RSS Feed
- Mark Topic as New
- Mark Topic as Read
- Pin this Topic for Current User
- Printer Friendly Page
IIS Worker Process Pool
- Mark as New
- Subscribe to RSS Feed
- Permalink
04 May 2021
01:27 PM
- last edited on
18 Jun 2021
10:20 AM
by
![]() MaciejNeumann
MaciejNeumann
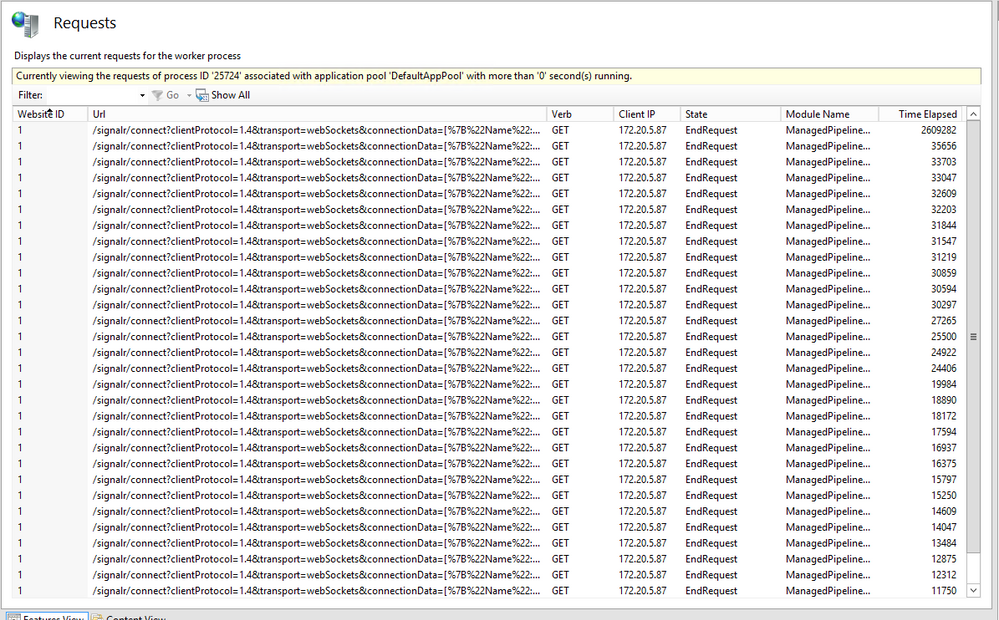
We have bunch of worker processes that are stuck in the pool. The picture below which I found from web is a representation of the situation.
I've checked metrics but couldn't find anything related to this. Do we have a feature to show at least the count of these requests that hoards available Worker Process Pools in Dynatrace?
- Mark as New
- Subscribe to RSS Feed
- Permalink
17 Jun 2021 11:16 PM
You might need to put in a Plugin or RFE for this
- Mark as New
- Subscribe to RSS Feed
- Permalink
04 Jan 2022 10:39 PM
Hi, I need the same view via Dynatrace.
Currently, the only way to monitor requests with long running time in the Application pool is via the IIS console.
Did you create the RFE for this improvement?
- Mark as New
- Subscribe to RSS Feed
- Permalink
05 Jan 2022 03:46 PM
This request has something to do with a Product Idea I posted some time ago:
Any upvotes will help in gaining visibility on this issue.
- Mark as New
- Subscribe to RSS Feed
- Permalink
05 Jan 2022 03:50 PM
Given that these requests are signalr, might it be that they are websocket connections, so they stay there for a certain amount of time? It does not solve the observability issue that I have replied moments ago, but might explain why you are seeing a bunch of them in the list...

