This website uses Cookies. Click Accept to agree to our website's cookie use as described in our Privacy Policy. Click Preferences to customize your cookie settings.
Open Q&A
If there's no good subforum for your question - ask it here!
Turn on suggestions
Auto-suggest helps you quickly narrow down your search results by suggesting possible matches as you type.
- Community Home
- Platform
- Open Q&A
- Re: Is it feasible to configure Dynatrace for automatic detection of @Scheduled methods in a Java application?
Options
- Subscribe to RSS Feed
- Mark Topic as New
- Mark Topic as Read
- Pin this Topic for Current User
- Printer Friendly Page
Is it feasible to configure Dynatrace for automatic detection of @Scheduled methods in a Java application?
Options
- Mark as New
- Subscribe to RSS Feed
- Permalink
02 Jan 2025
09:19 AM
- last edited on
07 Jan 2025
10:02 AM
by
![]() MaciejNeumann
MaciejNeumann
Hello,
We have created custom services in Dynatrace to detect @Scheduled methods in our Java application. Given the significant number of @Scheduled methods in our application, is there a way to configure Dynatrace to auto-detect these methods using rules or other configurations?
Thanks in advance.
Regards,
Siva Kumar
17 REPLIES 17
Options
- Mark as New
- Subscribe to RSS Feed
- Permalink
02 Jan 2025 10:04 AM
Hello @sivakumarp ,
Yes there's a way to auto-detect & monitor them. As far as I'm aware custom services can be used for this. And you'll define the technology as Java and fill out the rest as necessary. I believe this way it's a lot easier as well since it will all be done through the Dynatrace UI.
I have also attached an image as to where you can find custom services.

That's what I would do personally, so I hope that helped!
-Habiba Abdelaziz
Options
- Mark as New
- Subscribe to RSS Feed
- Permalink
02 Jan 2025 10:15 AM
Hi Habiba_A,
Thanks for the response.
As I mentioned earlier, we have successfully created custom services for detecting @Scheduled methods, and they are available in Dynatrace. Given the substantial number of schedulers in our application, I'm now exploring options for auto-detecting these methods using rules or other configurations.
Options
- Mark as New
- Subscribe to RSS Feed
- Permalink
02 Jan 2025 10:30 AM
In a recent case, I have done that configuration via API. That certainly helps when leading with large number of Custom Services.
The link is here. If you have doubts, use the same API to get an existing config, and then replicate it with this one...
Antonio Sousa
Reply
Options
- Mark as New
- Subscribe to RSS Feed
- Permalink
06 Jan 2025 10:06 AM
Yes, but typically you should instrument the particular abstract class being executed to automatically capture every task scheduled. I do it it for example with Quarz scheduler this way. You can also add request naming rules to better identify the executed task, if necessary.
Dynatrace Ambassador | Alanata a.s., Slovakia, Dynatrace Master Partner
Reply
Options
- Mark as New
- Subscribe to RSS Feed
- Permalink
06 Jan 2025 12:27 PM - edited 06 Jan 2025 12:27 PM
@sivakumarp For example, for the Quartz scheduler, instrument the org.quartz.Job interface and the execute method (create a custom service which bounds to this class and method execution). You may want to capture additional metadata using request attributes from the execution method's context argument.
This is just an example for Quartz, if your apps use different schedulers, I'd recommend following the same approach.
Dynatrace Ambassador | Alanata a.s., Slovakia, Dynatrace Master Partner
Options
- Mark as New
- Subscribe to RSS Feed
- Permalink
11 Jan 2025 04:33 AM
@Julius_Loman could you share how to instrument the execute method? I assume DynaTrace SDK needs to be used for this. If you could share a link to documentation how to do this it would be great. Thank you!
Options
- Mark as New
- Subscribe to RSS Feed
- Permalink
15 Jan 2025 07:49 PM
@sp72 using the Custom service method. For example, for Quartz scheduler you can use the Find entry point (1). You define a class/interface (2) in this case org.quartz.Job and then the metods, in this case execute (3). I recommend using the Find entry point (1) to define it.

This creates a custom service and executions of your jobs will be traced.
I hope this helps. Using the Dynatrace OneAgent SDK or OpenTelemetry SDK is also possible, but needs changes in the application code.
Dynatrace Ambassador | Alanata a.s., Slovakia, Dynatrace Master Partner
Reply
Options
- Mark as New
- Subscribe to RSS Feed
- Permalink
15 Jan 2025 08:01 PM
Could you also point me to OneAgent SDK and OpenTelemetry SDK documentation that describes how to mark methods in the source code? I'm trying to make this configuration automatically. Thank you!
Options
- Mark as New
- Subscribe to RSS Feed
- Permalink
08 Mar 2025 06:09 PM - edited 08 Mar 2025 06:12 PM
I added OneAgentSdk.traceCustomService() calls to me code but I cannot find any traces of the service name I provide as parameter when calling this method. Where should I see the service in DT UI? Is it possible to troubleshoot that the data is actually submitted?
I'm trying to navigate via Kubernetes cluster -> Workload -> Apache Process -> List of Services and the service list does not contain my custom service. Neither I can find it by name in Services section.
@Julius_Loman could you help with this and point me out where to look for the custom service information in DT?
Options
- Mark as New
- Subscribe to RSS Feed
- Permalink
09 Mar 2025 09:38 AM
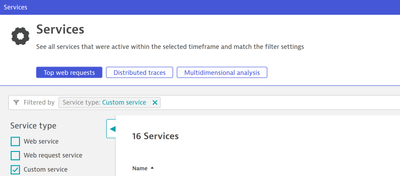
@sp72 look for custom services in your environment:
Also check if the OneAgent SDK is really used and initialized in your deployed process. You mention "Apache" - are you sure you are looking at the right process? Also, you need to look for Dynatrace services, not Kubernetes services.
Dynatrace Ambassador | Alanata a.s., Slovakia, Dynatrace Master Partner
Options
- Mark as New
- Subscribe to RSS Feed
- Permalink
10 Mar 2025 09:37 PM - edited 10 Mar 2025 09:39 PM
Somehow I don't see Custom Service option in the service type list. These are all the options I see:

I checked OneAgent status before calling traceCustomService() and it is set to ACTIVE.
Any idea why Custom Service option might not be available in service search?
Also, is custom service name used as it is provided in the call to traceCustomService(), are there any decorations added to the name? I tried to search by name without selecting service type but search returned nothing as well.
Options
- Mark as New
- Subscribe to RSS Feed
- Permalink
11 Mar 2025 06:06 AM
@sp72 in this case
- It has not been called in the timeframe you are looking at - most likely
- The oneagent feature flag is disabled
- The agent is not connected to the environment you are looking at
Also please check the oneagent log for the process. There is information about enabled sensors such as custom service.
Dynatrace Ambassador | Alanata a.s., Slovakia, Dynatrace Master Partner
Options
- Mark as New
- Subscribe to RSS Feed
- Permalink
11 Mar 2025 04:33 PM - edited 11 Mar 2025 04:41 PM
I tried searching for past several days (which is longer than the moment I started my tests), nothing can be found.
It seems like the feature is enabled, if I'm looking in the right place (this is from Manage -> Settings -> Preferences -> OneAgent features):

I don't see anything mentioning features enabled in the OneAgent sidecar logs.
Banging my head against the wall where else to look 🙂
Do I need to create custom service rules for this approach to work?
Options
- Mark as New
- Subscribe to RSS Feed
- Permalink
11 Mar 2025 09:38 PM
@sp72 no you don't if you create them using OneAgent SDK.
Are you also calling the tracer start() and end() methods on the tracer the traceCustomService method returns?
String serviceMethod = "onTimer";
String serviceName = "PeriodicCleanupTask";
CustomServiceTracer tracer = oneAgentSDK.traceCustomService(serviceMethod, serviceName);
tracer.start();
try {
	doMyCleanup();
} catch (Exception e) {
	tracer.error(e.getMessage());
	throw e;
} finally {
	tracer.end();
}
The traceCustomService call itself is not enough, you need to start and end the tracer.
Dynatrace Ambassador | Alanata a.s., Slovakia, Dynatrace Master Partner
Options
- Mark as New
- Subscribe to RSS Feed
- Permalink
11 Mar 2025 10:56 PM - edited 12 Mar 2025 03:53 PM
oh my. what a blunder on my part. I missed that I needed to call start() to actually start the tracer. Now I can see executions tracked in DT UI. Thank you very much for pointing this out!
The service names do not show up and seem to be replaced by the naming rules set on the DT instance. So now I need to figure out how to fix them 🙂
Featured Posts
