This website uses Cookies. Click Accept to agree to our website's cookie use as described in our Privacy Policy. Click Preferences to customize your cookie settings.
Open Q&A
If there's no good subforum for your question - ask it here!
Turn on suggestions
Auto-suggest helps you quickly narrow down your search results by suggesting possible matches as you type.
- Community Home
- Platform
- Open Q&A
- Is it possible to monitor slow queries and discover the code (and line) that originated this query?
Options
- Subscribe to RSS Feed
- Mark Topic as New
- Mark Topic as Read
- Pin this Topic for Current User
- Printer Friendly Page
Options
- Mark as New
- Subscribe to RSS Feed
- Permalink
28 Oct 2020 06:44 PM
Is there a way I can monitor slow queries on the database and discover which code originated this slow query?
I can see some queries on the Database section and get some information from PurePath on Transactions and Services, but I can't seem to find a way to know where the query was generated, like a complete stacktrace that shows which files (and which line) generated this query (I'm running a PHP application).
Is it possible to discover that with Dynatrace?
Solved! Go to Solution.
Labels:
- Labels:
-
databases
4 REPLIES 4
Options
- Mark as New
- Subscribe to RSS Feed
- Permalink
28 Oct 2020 10:52 PM
Hi Rafael,
This should be possible by performing a "Service Backtrace" within Dynatrace. See more on that here: https://www.dynatrace.com/support/help/shortlink/service-backtrace and here: https://www.dynatrace.com/support/help/shortlink/database-services#database-service-backtrace
More on how Dynatrace detects the database activity here: https://www.dynatrace.com/support/help/shortlink/database-detection
As your question relates to our Dynatrace SaaS and Managed offerings, I'll move this question to the appropriate forum. (Because "AppMon & UEM Q&A" relates to one of our classic products.)
Regards,
Andrew M.
Regards,
Andrew M.
Andrew M.
Reply
Options
- Mark as New
- Subscribe to RSS Feed
- Permalink
29 Oct 2020 02:48 PM
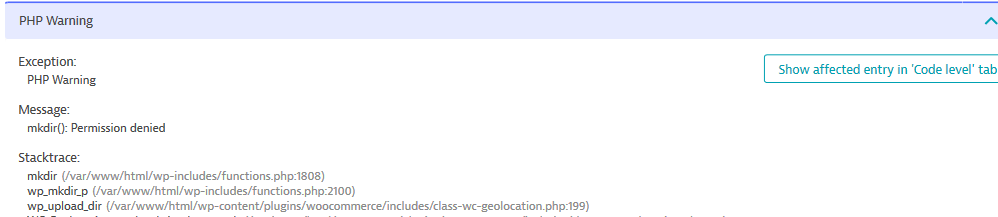
In Dynatrace you don't get it at the Purepath level, even when seen in "Code level". But given that PHP is (normally) interpreted, it might be possible. So probably this might be better considered an RFE.
It's a different case in errors, where that information is available:
Antonio Sousa
Reply
Anonymous
Not applicable
Options
- Mark as New
- Subscribe to RSS Feed
- Permalink
29 Oct 2020 03:54 PM
Actually, you can do something similar, wont give you the exact line of code, but you can see purepath:
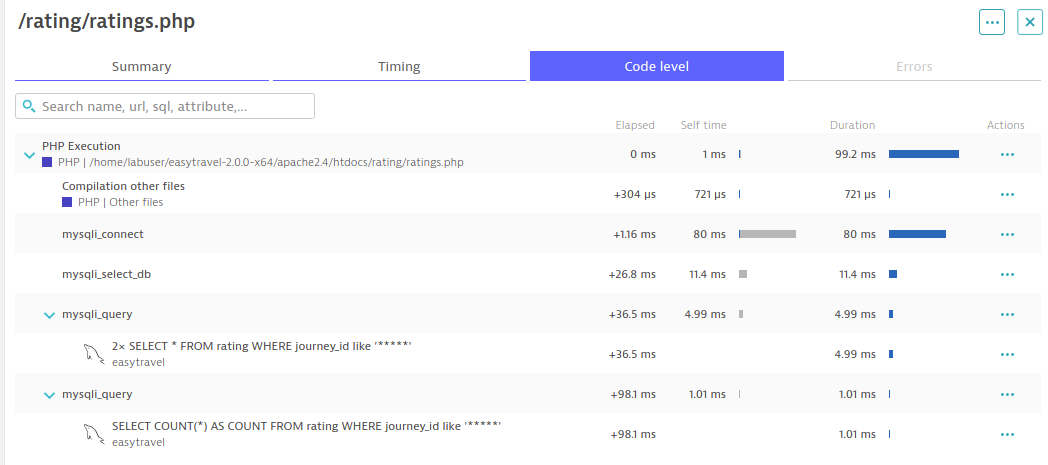
or an overall of all the calls and add a filter for calls to an specific DB and specific response time:
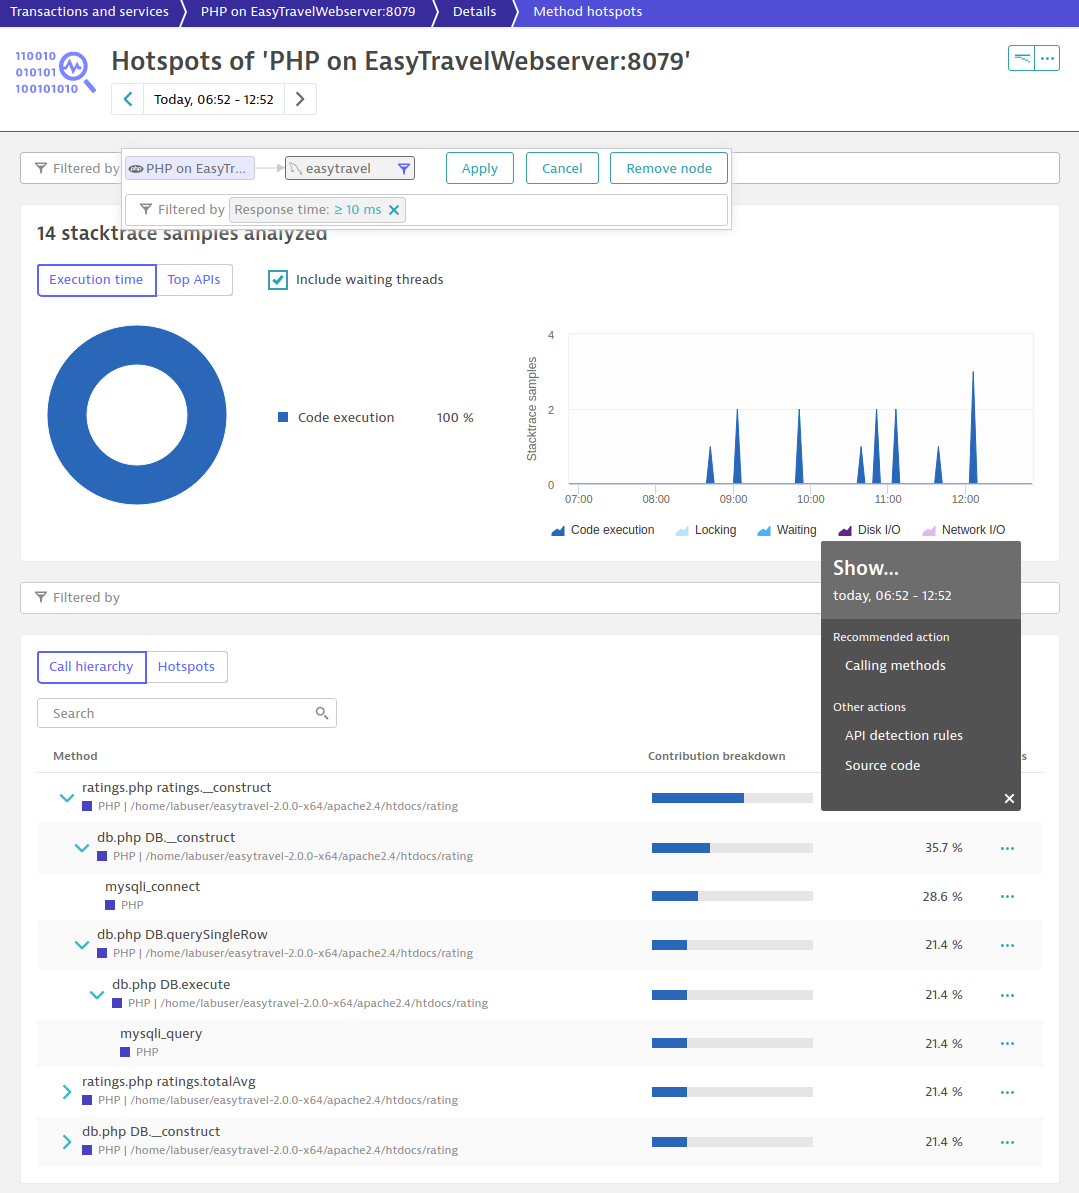
From there you can see the callstack or even download the source. The only thing that wont showup is the code line i think.
Reply
Options
- Mark as New
- Subscribe to RSS Feed
- Permalink
16 Jun 2023 03:11 PM
Nowadays you should also be able to get all the database queries and their response times and other metrics, from the database details under Database. If the information displayed is not specific enough, you can create your own multidimensional analysis views, and save them for the service.
create your own multidimensional analysis views, and save:


Kind regards, Frans Stekelenburg Certified Dynatrace Associate | Cegeka.com, Dynatrace Partner
Reply
Featured Posts
