- Dynatrace Community
- Ask
- Open Q&A
- Re: Is there any way to track all my host events on dashboard, can someone please help me on this
- Subscribe to RSS Feed
- Mark Topic as New
- Mark Topic as Read
- Pin this Topic for Current User
- Printer Friendly Page
- Mark as New
- Subscribe to RSS Feed
- Permalink
30 Nov 2023 06:54 AM - edited 30 Nov 2023 07:18 AM
- Mark as New
- Subscribe to RSS Feed
- Permalink
30 Nov 2023 07:58 AM
Hi @hemanth
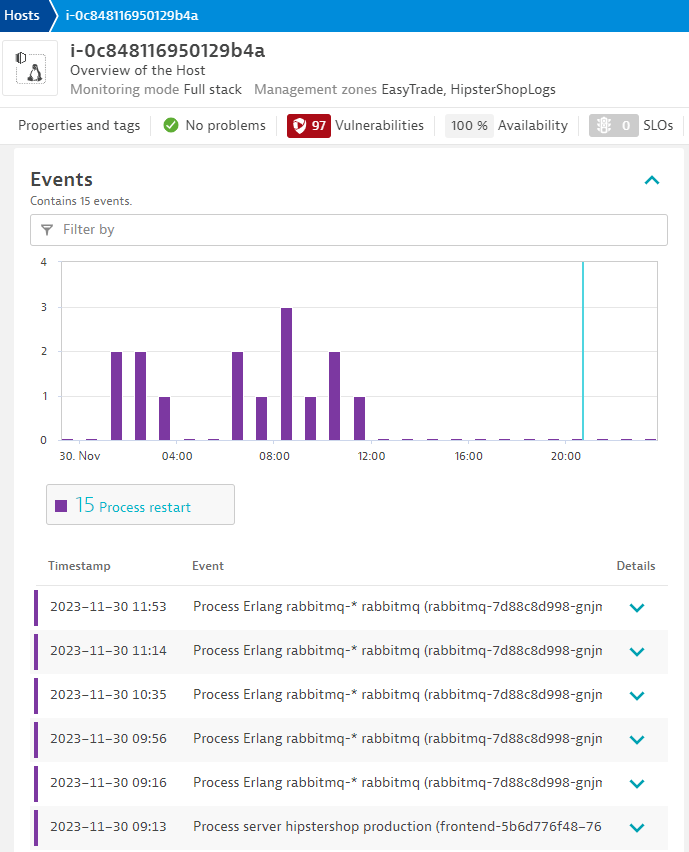
At the moment there is no such view available. You can configure Markdown Tile to link to relevant cockpits e.g. Process Crashes.
You can try to pull the rest of the information with the help of metrics, but it will rather be statistical information without Event description.
Radek
- Mark as New
- Subscribe to RSS Feed
- Permalink
30 Nov 2023 08:07 AM
Hi,
I have just not explore it yet but I do not know if that is possible using Grail + DQL.
Best regards
- Mark as New
- Subscribe to RSS Feed
- Permalink
30 Nov 2023 09:07 AM
Yes, it's possible with Grail/DQL.
I'll do some research on my own to find the correct syntax
- Mark as New
- Subscribe to RSS Feed
- Permalink
30 Nov 2023 04:22 PM
yes, please that would helpful @gbaudart
- Mark as New
- Subscribe to RSS Feed
- Permalink
01 Dec 2023 09:56 AM
Hi @hemanth
You may try :
fetch events
| filter dt.entity.host == "HOST-DA3D0FBDE137805E"
And you can display the count histogram with timestamps :
fetch events
| filter dt.entity.host == "HOST-DA3D0FBDE137805E"
| summarize count(), by:{timestamp}
let me know if this ok for you
- Mark as New
- Subscribe to RSS Feed
- Permalink
30 Nov 2023 09:27 AM
Yes, only this only works for the SaaS version.
We don't know what version @hemanth using 🙂
- Mark as New
- Subscribe to RSS Feed
- Permalink
30 Nov 2023 04:20 PM
@radek_jasinski using SaaS version .
Thanks
Featured Posts


