- Dynatrace Community
- Ask
- Open Q&A
- JMX extension and adding the host name to the message of custom event - Any luck with this?
- Subscribe to RSS Feed
- Mark Topic as New
- Mark Topic as Read
- Pin this Topic for Current User
- Printer Friendly Page
- Mark as New
- Subscribe to RSS Feed
- Permalink
05 May 2021
11:08 PM
- last edited on
01 Sep 2022
12:24 PM
by
![]() MaciejNeumann
MaciejNeumann
This seems like such a simple thing to do and maybe I have just been staring at the computer screen too long, but we have been trying to figure out how to add the host name to a custom event message for over 2 days now and nothing seems to work.
We have a JMX extension which looks at the MBean that is deployed to a cluster of Linux servers where the OneAgent has been installed (full stack on each server). From that MBean we have a few custom metrics we collect. From that we have custom events setup which work, but you can not see the host name the problem is on until you click into the problem. We want the problem message to include the host name where the problem is taking place.
Recently, Dynatrace added some things such as dims.host.name to custom events. But, no matter what we have tried it never seems to work. Has anyone else tried this and had success?
There appears to be no documentation on how to accomplish this that I can find. I would think that this would be as simple as a place holder in the custom event message considering Dynatrace already knows what host has the problem because it shows it when you click into the problem.
We also tried adding host.name as a dimension after the rx_pid which does show the dimension in the custom event configuration, but we noticed a few things. When that dimension is added after the rx_pid, the custom event never raises a problem. If you try to filter within the custom event configuration either by rx_pid or host.name, nothing is returned. Yet if we remove host.name as a dimension and then within the custom event configuration try to filter on rx_pid, we get the list of pids. This leads me to think it is actually broken once host.name is added to the JMX extension, yet Dynatrace does not say there is an error or provide any sign that it is not working.
I am out of ideas at this point. Hoping somebody has used this dims.host.name with a JMX extension and can show how they accomplished it.
Thanks!
Solved! Go to Solution.
- Labels:
-
jmx
-
metrics
-
problems classic
- Mark as New
- Subscribe to RSS Feed
- Permalink
06 May 2021 04:59 AM
Hi Larry,
I do not have time to review your discussion in full and greater detail, however had you reviewed the alert_settings for your JMX extension? https://www.dynatrace.com/support/help/shortlink/extensions-jmx-customize#alert-settings
I would think that either entity name, or first splitting by host dimension, would provide the placeholders you need?
Andrew
Andrew M.
- Mark as New
- Subscribe to RSS Feed
- Permalink
06 May 2021 05:25 PM
I have looked over the documentation multiple times and I can not figure out what I am doing wrong or what I am trying to do is even possible. Does the host name need to come from the MBean or should Dynatrace be able to match the custom MBean metric to the host it is on? I don't know why it would need to come from the MBean since Dynatrace already knows what host the custom event raised the problem for around the metric. Anytime I try to do anything with adding host.name into the dimensions it takes the extension, but the custom event never works.
"FailedJobCount" is the metric which comes out of wmsBatch.jar which is deployed to a cluster of servers monitored by Dynatrace. When there is a failed job, we want to raise a custom event but have the custom event message include the host name from the cluster that the failed job is on.
{
	"version": "1.06",
	"name": "custom.jmx.hostnametest",
	"type": "JMX",
	"metricGroup": "custom.jmx.hostnametest",
	"processTypes": [
		10,
		12,
		13,
		16,
		17,
		18
	],
	"entity": "PROCESS_GROUP_INSTANCE",
	"configUI": {
		"displayName": "WMS Host Name Test"
	},
	"ui": {
		"charts": [
			{
				"group": "WMS Host Name Test",
				"title": "Failed Job Count",
				"series": [
					{
						"key": "metric_FailedJobCount_1570648692788",
						"aggregation": "max",
						"displayname": "WMS Failed Job Count"
					}
				]
			}
		]
	},
	"metrics": [
		{
			"timeseries": {
				"key": "metric_FailedJobCount_1570648692788",
				"unit": "Count",
				"displayname": "WMS Batch - Failed Job Count",
				"dimensions": [
					"rx_pid"
				]
			},
			"source": {
				"domain": "Dynatrace",
				"keyProperties": {
					"category": "Batch"
				},
				"attribute": "FailedJobCount",
				"allowAdditionalKeys": true,
				"calculateDelta": false,
				"calculateRate": false,
				"aggregation": "MAX"
			}
		}
	],
	"source": {}
}
- Mark as New
- Subscribe to RSS Feed
- Permalink
07 May 2021 12:50 AM
Hi Larry,
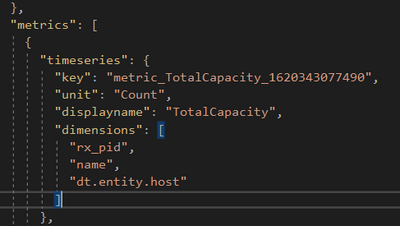
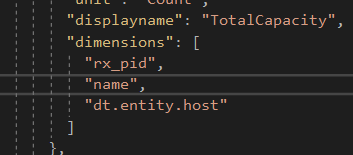
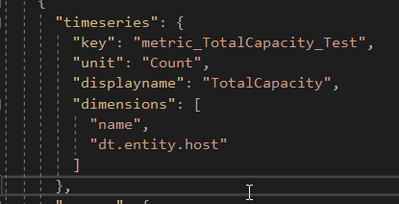
I tested four different scenarios. It looks like it is not possible to split by the host dimension, as the JMX extension is tied to a process group instance. I'm sorry this doesn't really help. See below for tests performed.
One: modify existing JMX extension to add host dimension:
dt.entity.hostExample:
Result:
Two: upload new extension with host dimension already added:
dt.entity.hostExample as above
Result:
Three: change JMX extension entity type to HOST, then retry:
Example:
Result:
Four: change JMX with entity type HOST AND remove rx_pid dimension:
Example:
Result:
Foru:
Andrew M.
- Mark as New
- Subscribe to RSS Feed
- Permalink
07 May 2021 01:23 PM
Thank you Andrew - Very much appreciated. I had tried some of those examples as well in trying to figure it out and had the same results.
"the JMX extension is tied to a process group instance"
Very true which is all the more reason why Dynatrace should allow the host name to be included so you know exactly which host process of the group is in breach. I know I was most likely not explaining the entire problem very well so thank you so much for taking the time to try to understand and try some things. I guess I will create an RFE for this. When they stated they added dims.host.name to custom events I guess I assumed that could be used for just about anything. Now it looks like that can most likely only be used if the custom event is host related so its back to the drawing board.
Thanks again!
- Mark as New
- Subscribe to RSS Feed
- Permalink
15 Nov 2021 11:27 PM
Hi Larry,
I have a complicated workaround.
If you create an auto-tagging rule to apply the hostname as a tag, then you can append the tagging values to a problem alert notification or custom event for alerting to include the hostname.
There's also more complicated rules can be created using entitySelector based rules to match of properties.
Andrew
Andrew M.
Featured Posts


