- Dynatrace Community
- Ask
- Open Q&A
- Memory page faults
- Subscribe to RSS Feed
- Mark Topic as New
- Mark Topic as Read
- Pin this Topic for Current User
- Printer Friendly Page
- Mark as New
- Subscribe to RSS Feed
- Permalink
12 Sep 2022
08:20 AM
- last edited on
12 Sep 2022
10:27 AM
by
![]() MaciejNeumann
MaciejNeumann
Hi Folks,
Is it possible to define which process is responsible for the high memory page faults on a host?
Thanks in advance.
Br, Mizső
Solved! Go to Solution.
- Labels:
-
hosts classic
- Mark as New
- Subscribe to RSS Feed
- Permalink
21 Sep 2022 09:48 PM
Hello,
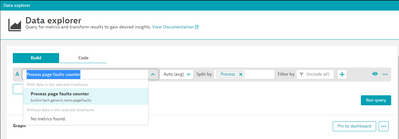
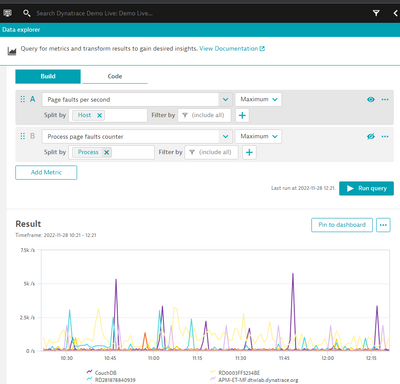
You can use the data explorer and the metric from the screenshot to see page faults per process group:
Thank you
- Mark as New
- Subscribe to RSS Feed
- Permalink
28 Nov 2022 09:19 AM - edited 28 Nov 2022 10:24 AM
Hi @bradley_danyo & @Mizső
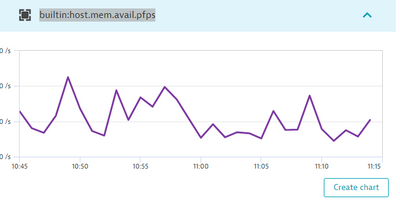
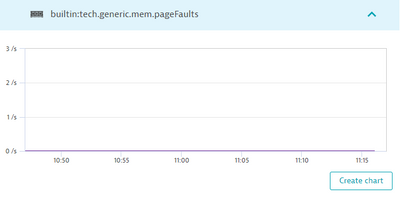
Tried this metric (builtin:tech.generic.mem.pageFaults) in few environments (v254) and its keep return 0, also for Maximum, while the host metric (builtin:host.mem.avail.pfps) return numbers.
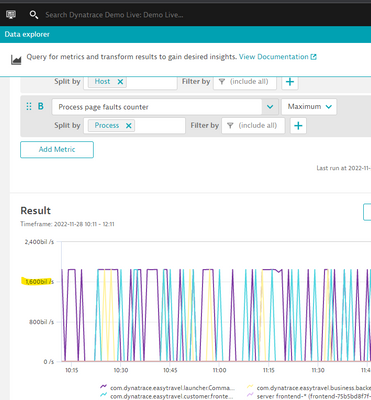
In demo environment found numbers for process level but they are not accumulate with the host level
In process we see billions page faults per second
While from host we see just few thousands per second
Any explanation on this odd behavior of the metric per process?
BTW, Is there a place within the UI ,old or new, that we can see this information regarding page faults per process ?
Thanks in advance
Yos
- Mark as New
- Subscribe to RSS Feed
- Permalink
21 Sep 2022 10:10 PM
Hi @bradley_danyo,
Thanks very much for the suggestion. It is a so simple solution. I have never heared about this metric.
Best regards, Mizső
- Mark as New
- Subscribe to RSS Feed
- Permalink
21 Sep 2022 10:50 PM
Sure thing glad I could help. If you're every curious and looking for a specific metric, you can always try searching in the data explorer or the Metrics tab on the left hand menu of the Dynatrace tenant.
- Mark as New
- Subscribe to RSS Feed
- Permalink
21 Sep 2022 11:16 PM
Shame on me. 😉 I have already been using DT since 2019 daily basis... so I would have thought this solution. Thanks again.
Have a nice day.
Br, Mizső
Featured Posts
