- Dynatrace Community
- Dynatrace
- Ask
- Open Q&A
- Near 100% Failure rate for localhost:9999/mbeacon
- Subscribe to RSS Feed
- Mark Topic as New
- Mark Topic as Read
- Pin this Topic for Current User
- Printer Friendly Page
Near 100% Failure rate for localhost:9999/mbeacon
- Mark as New
- Subscribe to RSS Feed
- Permalink
22 Sep 2023 05:34 PM
We are seeing almost 100% failure rate for request https://localhost:9999/mbeacon coming from service Dynatrace ActiveGate on port 9999. Does anyone know what this request represents? Should I be concerned with it being this high? One of our ActiveGates has <1% but 2 others are at almost 100%.
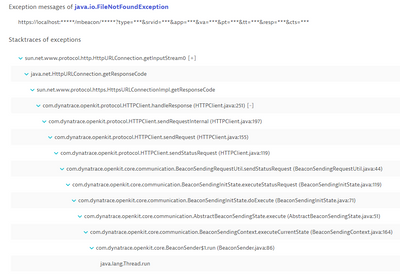
Looking at the failure details I see all were from java.io.FileNotFoundException but I don't really know how to dig deeper into how to fix this.
- Labels:
-
activegate
-
services
- Mark as New
- Subscribe to RSS Feed
- Permalink
22 Sep 2023 08:33 PM
Looks like an incorrectly custom app with openkit. Most likely it's an extension reporting to the ActiveGate (and trying to send data locally). What extensions is the ActiveGate running?
- Mark as New
- Subscribe to RSS Feed
- Permalink
22 Sep 2023 09:40 PM
Your comment led me down the path of looking at our custom applications. I found that the app ID in the relative URL of the trace (see below), refers to a custom app for endpoints associated with AG extension SAP Application Server (ID: custom.remote.python.sap).
I did find some custom apps associated with these endpoints configured to our internal vip that hits our ActiveGates, I changed the settings of each app to use the cluster AG. I believe the failures that are occurring now are associated with endpoints that have a custom app ID setup (in the endpoint settings) but no associated custom app actually created with that ID. Still doing some clean up. It is very likely that we removed some custom apps that have not had traffic in say 1 year, but did not remove the endpoint in the extension.


