- Dynatrace Community
- Ask
- Open Q&A
- Number of calls to each endpoint, the maximum and average response time by minute/hour via API
- Subscribe to RSS Feed
- Mark Topic as New
- Mark Topic as Read
- Pin this Topic for Current User
- Printer Friendly Page
- Mark as New
- Subscribe to RSS Feed
- Permalink
06 Aug 2020 02:23 PM
Hi all,
in our environment we have thousands of microservices, each with some endpoints (requests) , we want to obtain the number of calls to each endpoint, the maximum and average response time by minute/hour for each endpoint and microservice?
How can I get this information via API?
Regards, Josep Maria
Solved! Go to Solution.
- Labels:
-
java
- Mark as New
- Subscribe to RSS Feed
- Permalink
06 Aug 2020
09:27 PM
- last edited on
12 Feb 2024
10:57 AM
by
![]() IzabelaRokita
IzabelaRokita
I would recommend messing around with these:

If its not possible to accomplish this, they you can also always toss in a Product Idea:
https://community.dynatrace.com/t5/forums/postpage/board-id/DynatraceProductIdeas
- Mark as New
- Subscribe to RSS Feed
- Permalink
07 Aug 2020 12:22 PM
Hi Josep,
This really depends on how your microservices are structured within Dynatrace's Service layer. Does each Dynatrace Service represent a microservice endpoint, or are they represented like Requests under a Service? This will allow you to understand what metrics you need to extract (i.e. at Service level or at Key Request level).
Once you understand that you can head over to the Metrics API endpoint which allows granular access to extracting the details you've mentioned. The metrics you'll be working with are:
Service-level:
- builtin:service.requestCount.total
- builtin:service.response.time
Request-level (request must be marked as Key Request):
- builtin:service.keyRequest.count.total
- builtin:service.keyRequest.response.time
If you want to add additional aggregations to these you will have to specify them in brackets. This is all done in the metricSelector parameter. For example:
metricSelector=builtin:service.response.time:(max,avg)
The calls to /api/v2/metrics/query by default will bring in results for all possible dimensions (in this example Services and/or Key Requests) that collect this metric. To focus just on your microservices, start working with the entity selector:

At a minimum you will have to provide type. But a good approach is to add tags on top of this that you can use to identify these microservices. If I had a tag with key "Layer" and value "Microservices" I would structure it like so:
entitySelector=type("SERVICE"),tag("Layer:Microservices")The final bits are the timeframe and granularity. With the timeframe you will have to decide how frequently you're going to make these API calls. Whereas with granularity you mentioned you want it minute by minute. So if I wanted to grab the last 1hr of data minute-by-minute I would add the following parameters:
from=now-1h,resolution=1m
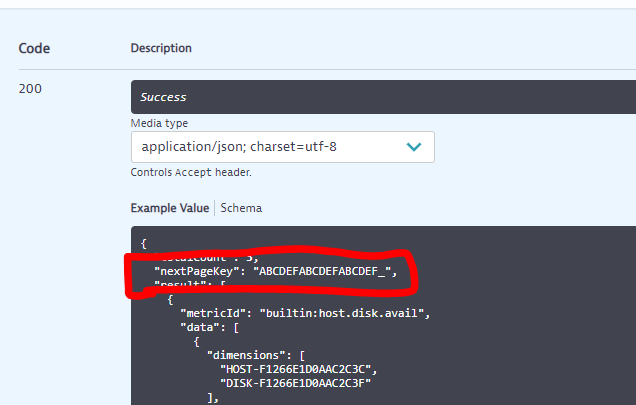
The final point to keep in mind is the pagination. Depending on how many of these entities you'll pull (you said you have thousands) - you will have to set the page size accordingly. So the pageSize parameter sets the maximum number of entities that will be retrieved per call out of the entire dataset (1 - 5000) - if your dataset is too large it will be paged and to retrieve the next page of results you will have to remove all other parameters (on subsequent calls) and instead just pass in the "nextPageKey" which will be give to you in the body of the response on all calls except the first.

I hope this info helps you out.
Best regards,
Radu
- Mark as New
- Subscribe to RSS Feed
- Permalink
24 Aug 2020 06:39 AM
Hi @Radu S. for your explanation!
So, if I want the metrics at a request level, I have to set as a key request all requests for which I want to get data?
And if this is true, what are the effects of setting the requests as a key request?
Regards, Josep Maria
Featured Posts
