This website uses Cookies. Click Accept to agree to our website's cookie use as described in our Privacy Policy. Click Preferences to customize your cookie settings.
Open Q&A
If there's no good subforum for your question - ask it here!
Turn on suggestions
Auto-suggest helps you quickly narrow down your search results by suggesting possible matches as you type.
- Community Home
- Platform
- Open Q&A
- Re: PurePath visualization change in new releases
Options
- Subscribe to RSS Feed
- Mark Topic as New
- Mark Topic as Read
- Pin this Topic for Current User
- Printer Friendly Page
Options
- Mark as New
- Subscribe to RSS Feed
- Permalink
21 Jan 2020
10:11 AM
- last edited on
13 Apr 2023
10:54 AM
by
![]() Karolina_Linda
Karolina_Linda
Hello, Dynatrace.
I was trying to rise this question with "In-product chat", but had only partial answer.
Few month ago at our Dynatrace managed installation there was a noticeable reduction of useful information I could get from PurePath details dashboard. Beforehand we could have a statistics like that: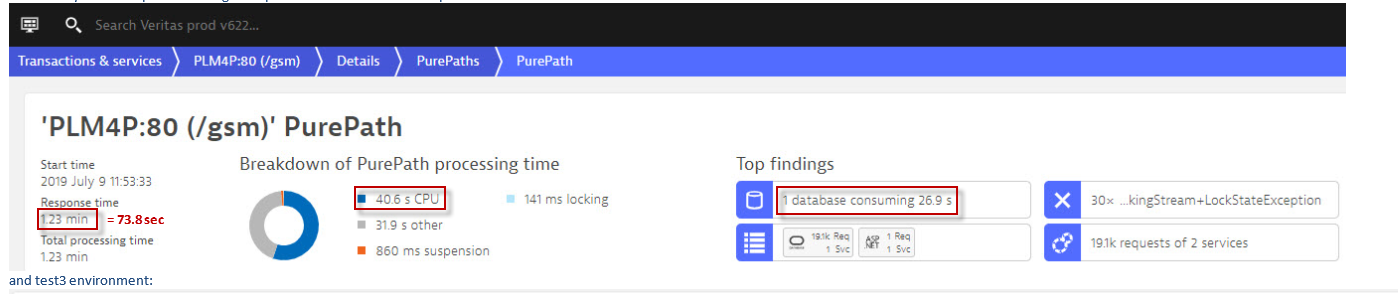
It was really helpful, especially if we need to display our finding to the teams or application vendors who don't have an access to our Dynatrace managed installation. Now it looks as the following:
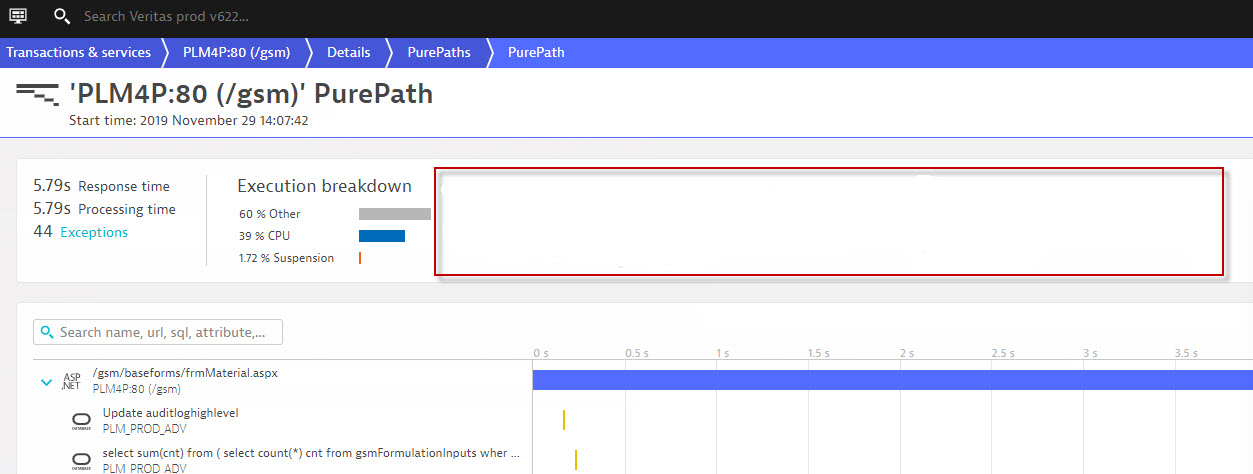
I still can get the same details with "Response time hotspots". But is is far no the same convenient: it adds many additional steps during investigation phase and makes harder to explain our findings to the people, who are not familiar with Dynatrace.
Why did you do that?
Solved! Go to Solution.
Labels:
- Labels:
-
distributed traces classic
Reply
1 REPLY 1
Options
- Mark as New
- Subscribe to RSS Feed
- Permalink
21 Jan 2020 12:49 PM
Timing section of Purepath was enhanced and contains more readable data comparing to compressed info in original purepath "top findings".
Alanata a.s.
Featured Posts
