- Dynatrace Community
- Ask
- Open Q&A
- Re: Reasons for failed requests - Plot over time?
- Subscribe to RSS Feed
- Mark Topic as New
- Mark Topic as Read
- Pin this Topic for Current User
- Printer Friendly Page
- Mark as New
- Subscribe to RSS Feed
- Permalink
13 Jun 2022
02:18 AM
- last edited on
13 Jun 2022
09:36 AM
by
![]() MaciejNeumann
MaciejNeumann
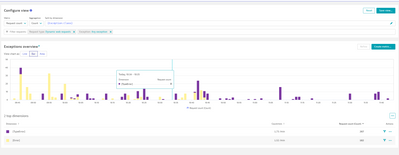
Dynatrace allows me to plot an exception over time as below.
Is there a way to plot or query the Message within the exception over time like the below?
Solved! Go to Solution.
- Mark as New
- Subscribe to RSS Feed
- Permalink
13 Jun 2022 09:14 AM
Hello Benjamin,
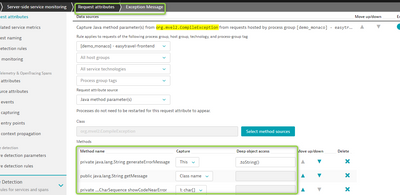
To answer you quickly, yes it is possible via Request Attribute.
Thus, to have to do this properly, you have to select your Exception class name, please see below the screenshot :
Afterward, you will be able to plot onto your MDA chart as new detected placeholder, and eventually convert to custom metrics (calculated service metrics).
Thanks
- Mark as New
- Subscribe to RSS Feed
- Permalink
13 Jun 2022 10:36 PM
Alas! I am using Node.js and cannot find the corresponding Request attribute source as you have shown for Java.
I'm assuming for Node.js the SDK approach is going to be suggested.
Thanks for the Information. I consider it answered for "supported technologies"
- Mark as New
- Subscribe to RSS Feed
- Permalink
14 Jun 2022 08:51 AM
Yes indeed, need to do some customisation here.
Capture any request attributes using OneAgent SDK | Dynatrace news
Github link : https://github.com/Dynatrace/OneAgent-SDK-for-NodeJs#set-custom-request-attributes
Thanks
- Mark as New
- Subscribe to RSS Feed
- Permalink
15 Sep 2022 11:40 PM
I have found another approach for nodeJS.
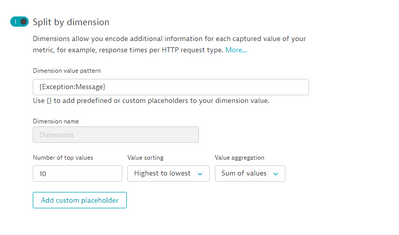
Create an exception based custom metric and in the advanced settings it allows you to split by
Exception:Message
- Mark as New
- Subscribe to RSS Feed
- Permalink
23 Sep 2022 10:46 AM
Hi @benjamin_mullan ,
Thanks for sharing, yes indeed you can use by custom metric (Calculated service metric), only if your dimension {Exception:Message} has enough parameters to get it. Otherwise, you have to configure via Request Attribute to deep dive on it and hope to pull more content into parameter.
Featured Posts


