- Dynatrace Community
- Dynatrace
- Ask
- Open Q&A
- Response time analysis on Apache mod_proxy
- Subscribe to RSS Feed
- Mark Topic as New
- Mark Topic as Read
- Pin this Topic for Current User
- Printer Friendly Page
Response time analysis on Apache mod_proxy
- Mark as New
- Subscribe to RSS Feed
- Permalink
19 Apr 2022
09:42 AM
- last edited on
20 Apr 2022
06:57 AM
by
![]() Karolina_Linda
Karolina_Linda
Hi, We have recently installed Dynatrace on one of my Apache node. We’re seeing decrease in Apdex score(bad user experience) and we are trying to find the root cause and tune our application to improve response time.
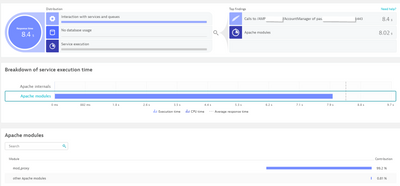
While analyzing when I select a sample purepath, I see something like screenshot attached. In the section top findings it says that 8.02 seconds was consumed on Apache mod_proxy.
When i click on apache Module it says 99.2% contribution from mod_proxy and nothing is available after that.
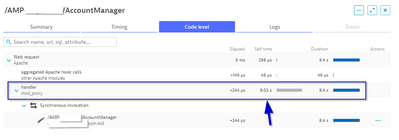
Also in the purepath view, I see high self-time on mod_proxy and in timing section, next hops after apache show that they consumed only ~360 ms. Majority of the time was spent(~8 seconds) was spent on mod_proxy.
What does this mean? Does it indicates there is something wrong with my mod_proxy of Apache? If yes what is it? How do i find out? Or is there a way to get further breadown of 8.02 seconds consumed on Apache mod_proxy?
Please guide me to dig a bit deeper to find out the cause. Appreciate any help
- Labels:
-
apache
-
distributed traces
- Mark as New
- Subscribe to RSS Feed
- Permalink
19 Apr 2022
12:08 PM
- last edited on
20 Apr 2022
12:15 PM
by
![]() andre_vdveen
andre_vdveen
Hi,
As per the data provided, it is the mod proxy module that needs tuning at application configuration/or code level. Mod proxy uses AJP for reverse and forward proxy. You can try enabling debug logging at the Apache service level with application or Apache service configuration if accessible and capture custom logs in Dynatrace.
- Mark as New
- Subscribe to RSS Feed
- Permalink
20 Apr 2022 10:02 AM
Hi @keshav_dixit ,
the issue you are facing may have various root causes depending on your setup. DNS, firewall, OS issues, inappropriate apache mod_proxy configuration etc. First definitely check the apache error log.
Does it happen for all requests or for some specific ones? Does it happen in every request?
- Mark as New
- Subscribe to RSS Feed
- Permalink
20 Apr 2022 05:18 PM
Thank you KG and Julius!
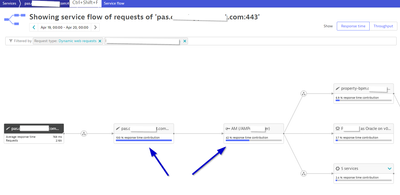
We're looking at mod_proxy config and error logs. It is happening for most of the requests, see below service flow for yesterday(big difference in response time contribution)
- Mark as New
- Subscribe to RSS Feed
- Permalink
20 Apr 2022 05:50 PM
Try to execute the same request from the apache host with curl/wget to get the idea. Check also if DNS is working properly - you can see it in Dynatrace on the host level. Maybe also try to add the host entries in /etc/hosts.
- Mark as New
- Subscribe to RSS Feed
- Permalink
21 Apr 2022 06:53 PM
Should we be concentrating 1st apache server or 2nd apache server? The reason I ask this is because 2nd apache servers was new introduction("apche + JBoss" replaced WAS), but I see that self time 1st apache server is high, which has been around for a year+.
Thanks,
Keshav
- Mark as New
- Subscribe to RSS Feed
- Permalink
21 Apr 2022 08:31 PM - edited 21 Apr 2022 08:31 PM
On the PP above you can notice the light blue color on the second apache which indicates client-side response time. This means the first apache issued the request, however, the processing started after a few seconds. This could be also queuing on the 2nd apache.
Service flow shows response time from the caller side, so it shows 100%. If other distributed traces have similar timings, then the issue is between apache servers or some setting on the second apache (queuing?).


