- Dynatrace Community
- Ask
- Open Q&A
- ResponseTime much less than ProcessingTime
- Subscribe to RSS Feed
- Mark Topic as New
- Mark Topic as Read
- Pin this Topic for Current User
- Printer Friendly Page
- Mark as New
- Subscribe to RSS Feed
- Permalink
04 May 2020 06:29 PM
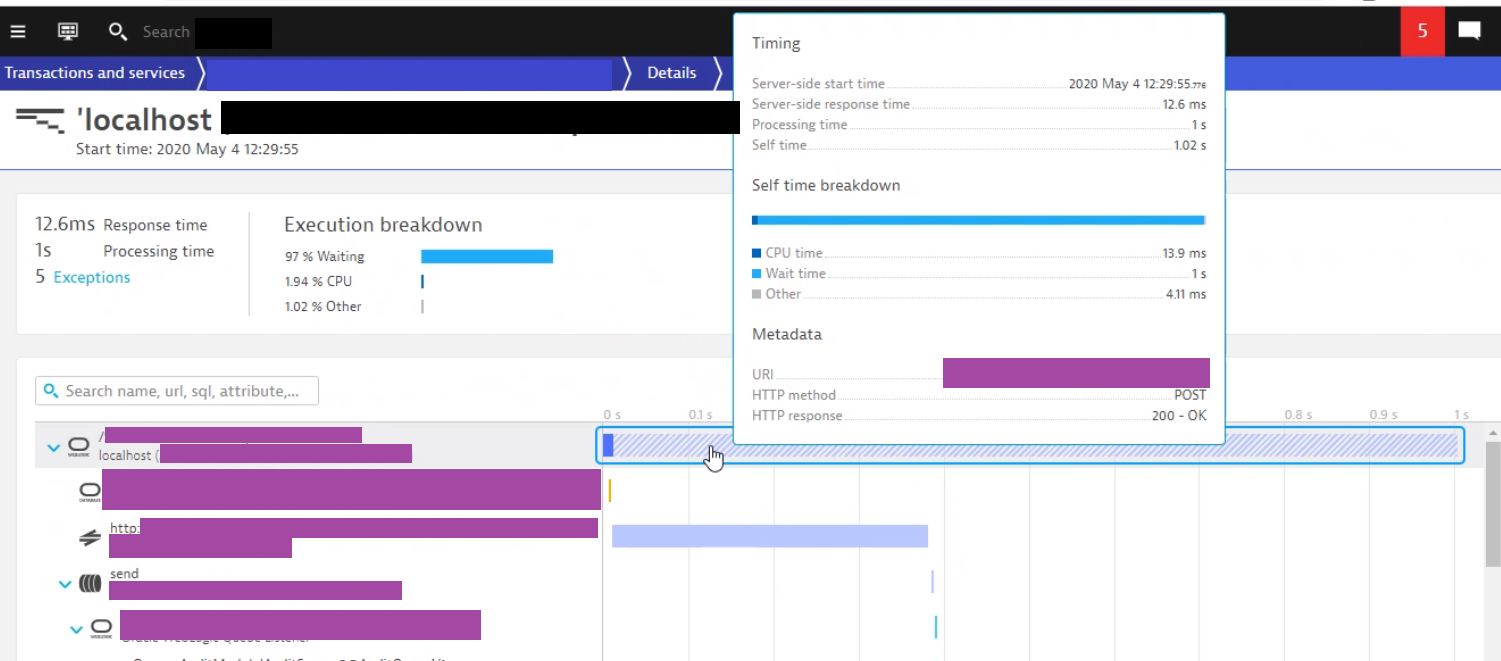
I have an interesting Purepath below where I'm given a response time of 12.6 ms, but then the processing time is 1 second.
The purepath does involve calling a service (SAP in this case) that takes consistently several hundred milliseconds. It does some other things. Than it seems to sleep (got that from the Method Hotspots) until the one second limit. In this service, none of the requests are below 1 second, but some take some more time.
I'm not sure what might be causing this behavior. I can imagine that the POST response time does not include all the payload, and that it is only being delivered by the one second mark. Or some type of assyncronous invocation... Does someone have a clue?

Solved! Go to Solution.
- Labels:
-
distributed traces classic
- Mark as New
- Subscribe to RSS Feed
- Permalink
04 May 2020 09:26 PM
This is normal since the call to SAP is asynchronous. Basically your service you are looking at responds quickly (low response time), calls external service asynchronously and the process the response. Asynchronous execution is shown as the dashed blue bar. If the call is asynchronous can be also seen in the code tab or in the service flow for the request.
The waiting time is calculated from the method hotspots (snapshots from the stack traces). This just indicates the processing waited for a significant amount of samples (careful, it is not time spent, it's number of stacktrace samples) waiting for the external call to finish.
It's normal with asynchronous calls to see purepaths with low response time and processing time in minutes.
- Mark as New
- Subscribe to RSS Feed
- Permalink
04 May 2020 11:03 PM
Interesting. Not a SAP expert, but it seems it's not that unusual. I'm trying to graph SAP's real time response through CustomCharts ->TimeSpentInCallsToOtherServices, but here I can get only SUM aggregation. Any idea where I can get a more interesting graph?
Featured Posts
