- Dynatrace Community
- Ask
- Open Q&A
- Slowest 10% and Slowest 5% - Dynatrace SaaS
- Subscribe to RSS Feed
- Mark Topic as New
- Mark Topic as Read
- Pin this Topic for Current User
- Printer Friendly Page
- Mark as New
- Subscribe to RSS Feed
- Permalink
21 Apr 2017 09:32 AM
Hi,
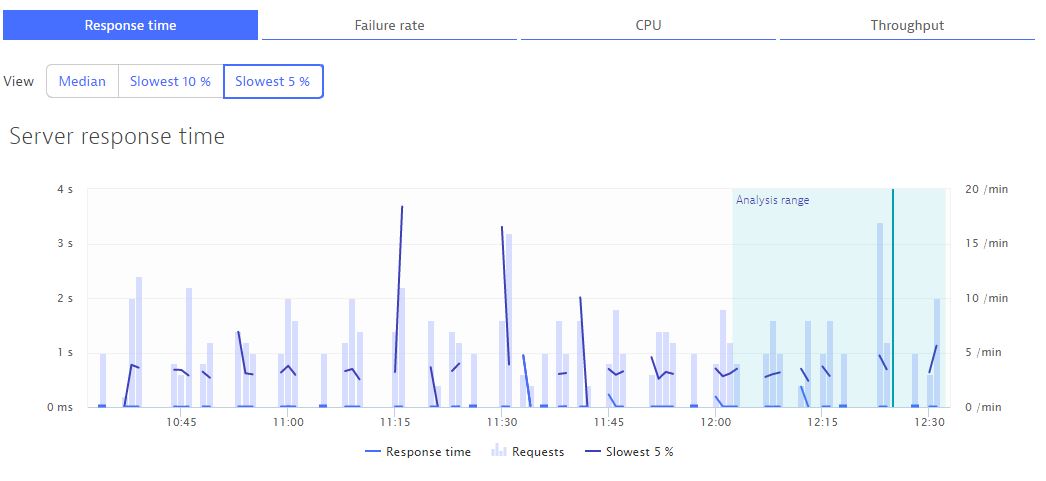
In dynatrace SaaS, for the response time graph noticed that "Median, slowest 10% and Slowest 5%" .Please help me to understand how these 3 are calculated , if we switch over we can see left side in y axis(response time) changing . Thanks in advance!

Thanks
Soorya Mohan
Solved! Go to Solution.
- Labels:
-
dynatrace saas
- Mark as New
- Subscribe to RSS Feed
- Permalink
27 Apr 2017 07:39 AM
Thanks Andi!! I will check in that forum!!
- Mark as New
- Subscribe to RSS Feed
- Permalink
05 Nov 2018 01:38 AM
Median - Is the 50th percentile value.
Slowest 10% - Is the 10th percentile value.
Slowest 5% - Is the 95th percentile value.
These values are for the period one gets while the hover on the graph.
- Mark as New
- Subscribe to RSS Feed
- Permalink
06 Nov 2018 08:45 PM
I think you had a typo. Here's the correct understanding:
Median - 50th Percentile Value
Slowest 10% - 90th Percentile Value
Slowest 5% - 95th Percentile Value
- Mark as New
- Subscribe to RSS Feed
- Permalink
07 Nov 2018 01:05 AM
Hi Joshua,
Thanks for correcting, yes Median would separate the higher half with the lower half.
Regards,
Akshay
Featured Posts
