- Dynatrace Community
- Dynatrace
- Ask
- Open Q&A
- The "Overview" in the Purepath view clearly show the response time of the request.
- Subscribe to RSS Feed
- Mark Topic as New
- Mark Topic as Read
- Pin this Topic for Current User
- Printer Friendly Page
The "Overview" in the Purepath view clearly show the response time of the request.
- Mark as New
- Subscribe to RSS Feed
- Permalink
03 Nov 2021
01:45 AM
- last edited on
03 Nov 2021
08:18 AM
by
![]() MaciejNeumann
MaciejNeumann
Hi Everyone,
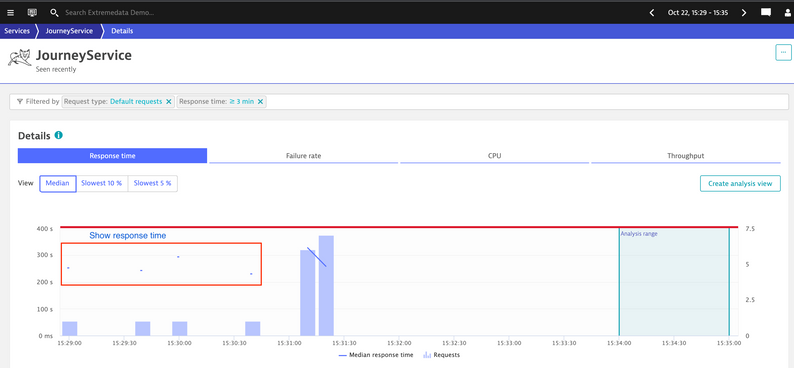
"response time view" would mark the response time of the request, even if there is only one request. (As shown below)
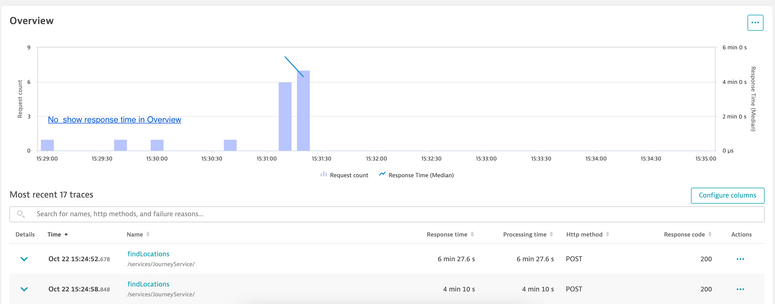
But when I traced down to the Purepath view, the label on "Overview" was not like the view on the upper level, not clearly marking the respsone time.
I don't know what caused the difference in the presentation of these two graphs, but if the response time can also be marked on the "Overview", the switching comparison between "response time view" and "Overview" can be reduced.
Thank you,
Owen
- Labels:
-
distributed traces
-
gui
-
services
- Mark as New
- Subscribe to RSS Feed
- Permalink
30 Mar 2022 04:37 PM
Interesting, what Cluster Version are you on? you might want to toss in a support ticket as this is not intended within the product from what I am aware of.


