- Dynatrace Community
- Ask
- Open Q&A
- Re: Varnish Cache Monitoring in Dynatrace
- Subscribe to RSS Feed
- Mark Topic as New
- Mark Topic as Read
- Pin this Topic for Current User
- Printer Friendly Page
- Mark as New
- Subscribe to RSS Feed
- Permalink
07 Apr 2022
12:16 AM
- last edited on
01 Sep 2022
01:46 PM
by
![]() MaciejNeumann
MaciejNeumann
Hi, I have a web application which is being monitoring by Dynatrace using agentless injection. That application makes call to our content management system (Strapi) to fetch the content via Varnish Cache layer. The Strapi and Varnish both are running as a container in kubernetes Cluster which also we are monitoring using Dynatrace.
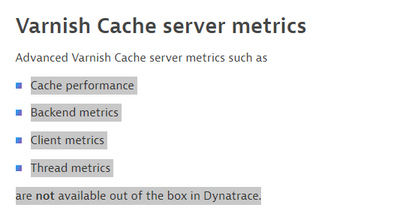
After deployment when we restarted all the processes, I am not seeing much of information from Varnish Cache. I'd like to see things like TCP requests, round trip time Cache hits and miss etc. Some of them should be available out of the box as per this documentation Varnish monitoring.
I've a questions like is it a good idea to monitor Caching servers like Varnish with Dynatrace. There is not much documentation available for it apart from what I have shared above. It has also been mentioned that it can lead to unexpected results unless you do some configuration as suggested in the workaround (which btw we already did before we deployed Dynatrace on our Cluster).
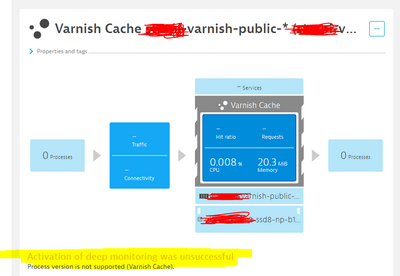
How do i get these metrics for Varnish in Dynatrace. At the moment when I look at the process instance in Dynatrace it says "Activation of deep monitoring was unsuccessful. Process version is not supported (Varnish Cache)." Screenshot attached.
What does it mean? Dynatrace does not support Varnish and we won't get the relevant metrics out of it.
Since our front end and the backend (Strapi) all the monitored using Dynatrace, I was hoping that it would be ideal to use this for Varnish as well so that we get the linking in purepaths and try to understand the Cache hit and miss behaviour.
If anyone can shed some light on this, that would be highly appreciated. Many Thanks in advance.
Solved! Go to Solution.
- Labels:
-
hosts classic
-
metrics
-
technologies
- Mark as New
- Subscribe to RSS Feed
- Permalink
13 Apr 2022 10:54 AM
I believe you didn't miss this section? to make the required metrics available, you have to push it from varnishstat into Dynatrace
- Mark as New
- Subscribe to RSS Feed
- Permalink
19 Jan 2023 03:29 PM - edited 20 Jan 2023 05:57 AM
Hi @techean ,
I've got now the same situation like @shashank_b_agra . We are migrating from Apache Traffic Server to Varnish because on the "supported technology" site varnish is mentioned. So I was very happy to leave Apache Trafficserver. But this was only for a short time.
When I have a closer look at the described solution in the dynatrace documentation you only find a link to a 3 year old scipt on github that only works with custom devices and consumes DDUs:
https://github.com/Dynatrace/snippets/tree/master/technologies/varnish/monitor-varnish-cache
So I can say: Varnish is unsupported by Dynatrace. You can only see the metrics like metrics from every other unsupported process. I can pull metrics from nearly every technology by telegraf, prometheus or similar to the API. Even when they are unsupported.
What the customer needs:
Varnish is often running on fullstack monitored Hosts. So we don't want additional API-calls because we have an agent on each system. We need the metrics at the place, where Dynatrace is showing them:
And we need traces, where we can find out, if varnish works well or not.
What the customer don't want:
We don't need additional metrics in the big metric-pool, we need them where they appear. At the Host, the process or the service. In this case: As you can see on the screenshot at the process. We have bought Dynatrace to not just collect metrics.
Please help us for a customer friendly, solution-oriented solution and please change the notification "Activation of deep monitoring was unsuccessful" to "opaque service".
Thanks for your help,
Götz
Featured Posts


