- Dynatrace Community
- Ask
- Open Q&A
- Re: What counts as "Other processes"?
- Subscribe to RSS Feed
- Mark Topic as New
- Mark Topic as Read
- Pin this Topic for Current User
- Printer Friendly Page
- Mark as New
- Subscribe to RSS Feed
- Permalink
28 Oct 2019
09:15 AM
- last edited on
15 Dec 2021
02:30 PM
by
![]() MaciejNeumann
MaciejNeumann
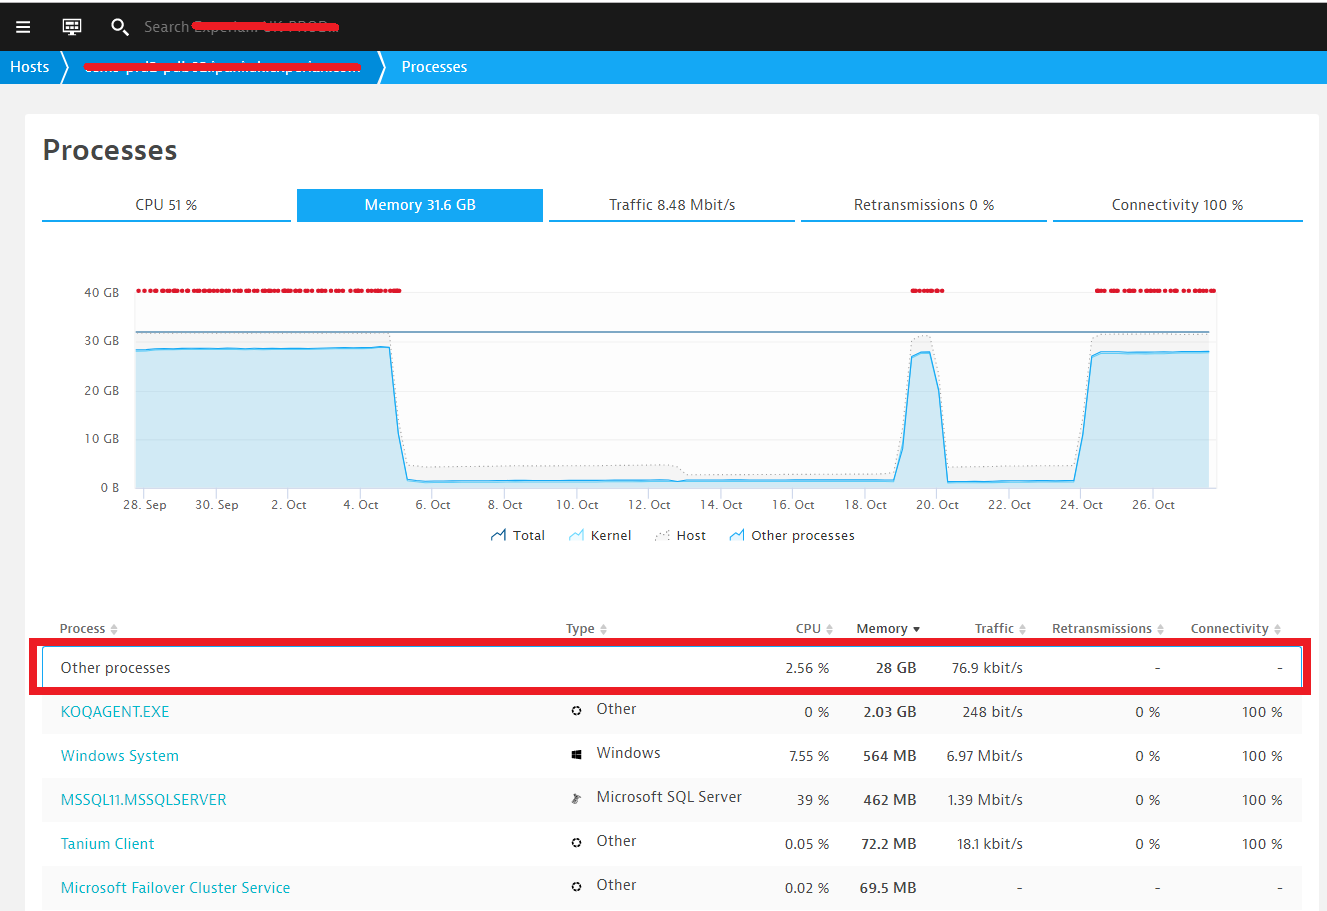
Many hosts now also show an entry in the process list labelled as "Other processes".
What does "Other processes" actually represent?
Most important processes (i.e. suitable for deep monitoring) are listed in the Host details page, others that we see running on the host are listed when we drilldown to the complete process list, this including even technologies that we label as "Other", yet there's also this entry for "Other processes".
Any idea what rules we have for this entry?

Solved! Go to Solution.
- Labels:
-
process groups
- Mark as New
- Subscribe to RSS Feed
- Permalink
28 Oct 2019 09:26 AM
I think those are processes that do not fall into any of the categories of detected processes:
So basically processes of unknown technologies, without TCP listening port, without significant CPU/Memory/Network usage) and without custom process detection rule definition.
But a clear definition in the documentation would be definitely appreciated.
- Mark as New
- Subscribe to RSS Feed
- Permalink
12 Nov 2019 11:45 AM
The "Other processes" unfortunately does not have any process group identification.
You can see running processes in the debug information when downloading Support archive from the agent (see processesSnapshot.log and other files), but might not be easy to figure out which process did the load. But at least you will have a clue what is running on the host without touching the host itself.
Many other monitoring tools I've seen also cannot identify the particular process generating load unless it is explicitly defined to be monitored. In Dynatrace you can do that with process group detection rules.
- Mark as New
- Subscribe to RSS Feed
- Permalink
29 Oct 2019 09:40 AM
It should include everything other that what is seen here in the list, basically would be processes of type/technology which are not supported by Dynatrace/OneAgent.
- Mark as New
- Subscribe to RSS Feed
- Permalink
01 Nov 2019 06:27 AM
You can split out ones that are in other processes to always show if you want to. https://www.dynatrace.com/support/help/how-to-use-dynatrace/process-groups/configuration/set-up-proc...
- Mark as New
- Subscribe to RSS Feed
- Permalink
05 Nov 2019 02:30 PM
Hi All,
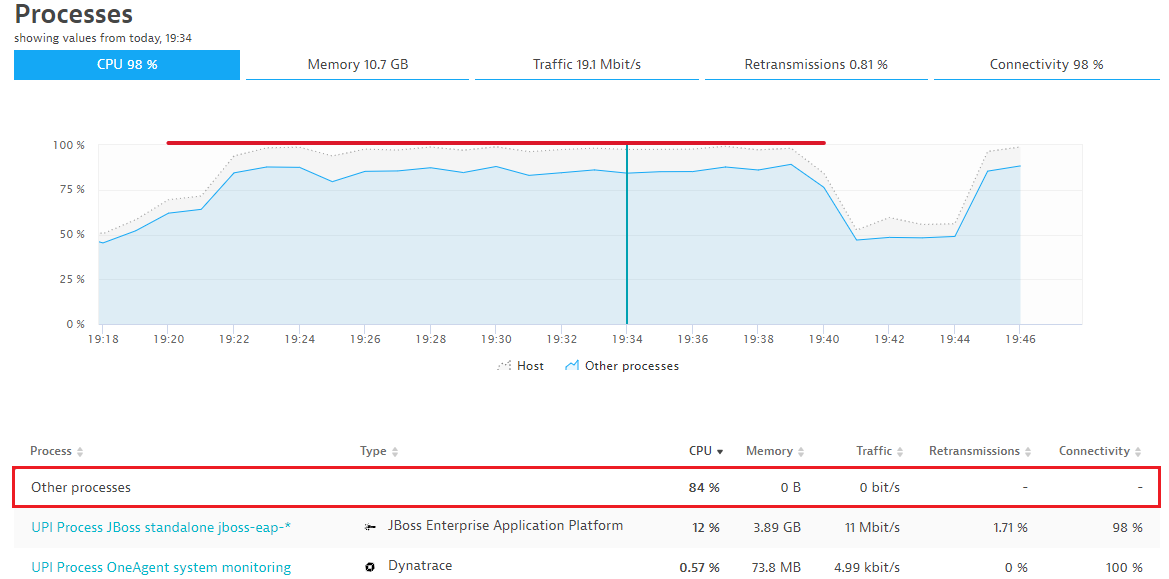
I am in the same situation where we are unable to get the detail from Dynatrace as it is showing the top consumed process is "other process". We are forced to suggest some other tool to the client for getting the required details which are a very questionable thing. The client is asking why Dynatrace is not able to get the details which are intended to get from Dynatrace.
Kindly share if any document addressing "Other process" thing in Dynatrace 
- Mark as New
- Subscribe to RSS Feed
- Permalink
08 Nov 2019 09:41 AM
I also quite interest to know the answer to this as well.
I think at least the 'Other processes' should gives some other additional hints for examples, PIDs, ports etc etc...
- Mark as New
- Subscribe to RSS Feed
- Permalink
11 Nov 2019 12:42 PM
Dear All,
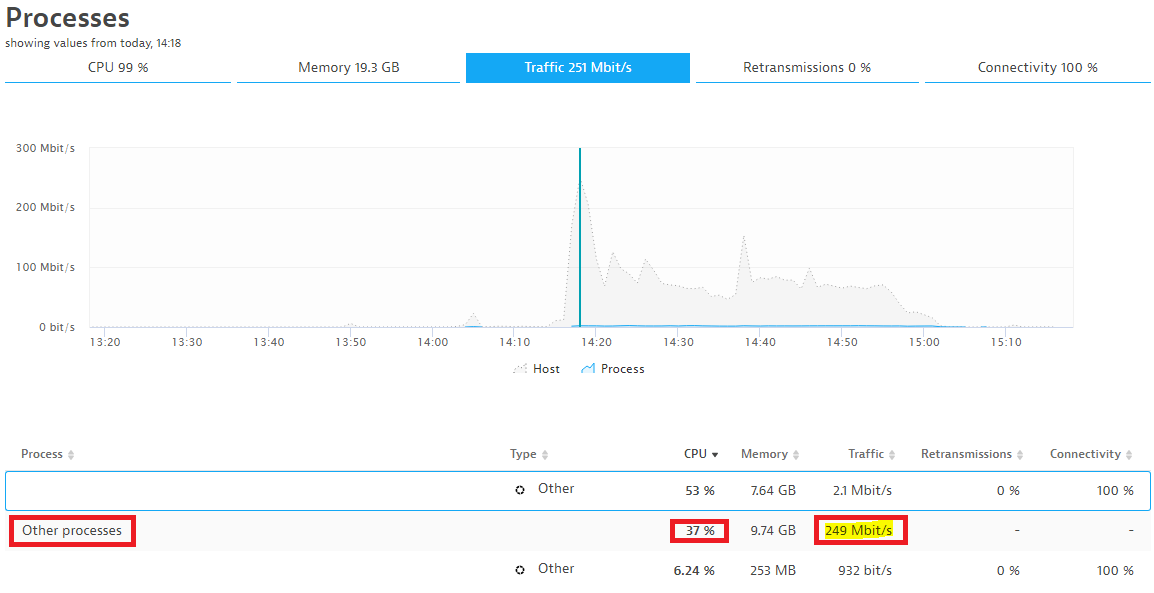
How to interpret the following?
The CPU utilization was 99%, during that time 53% was taken by the known process and 37% taken by the other processes.
The situation is that the traffic was far higher for the other processes than the traffic to/from the known process.
Which process(s) has/have received/sent the huge traffic?

Regards,
Babar
- Mark as New
- Subscribe to RSS Feed
- Permalink
11 Nov 2019 08:58 PM
Depends... Is this on Solaris, Linux, or Windows? I see this all the time with Solaris.
- Mark as New
- Subscribe to RSS Feed
- Permalink
27 Jan 2020 09:56 PM
Actually, if anyone needs the info, you can find which processes are grouped under "Other processes" by downloading support archive for the host and looping through processesSnapshot.log in the diagnostic_files.zip.
Here is a one-liner:
unzip -f support_archive.zip diagnostic_files.zip && unzip -p diagnostic_files.zip "AGENT/*/logs/os/processesSnapshot.log"| awk '/Group name:/ { if (group!="") print "Unrecognized PG:",group; $1="";$2="";group=$0;}; /Monitoring rule used:/ { print "Recognized PG:",group; group=""}' processesSnapshot.log |sort && rm diagnostic_files.zipThis prints out a list of known process groups that will be shown in Dynatrace UI and as well as those hidden ones:
...
Recognized PG:   sshd
Unrecognized PG:   agetty
...
If you need details, just check the processesSnapshot.log for more information.
- Mark as New
- Subscribe to RSS Feed
- Permalink
06 Feb 2020 05:57 PM
Hi Julius, what OS did you use to parse out the .zip file?
- Mark as New
- Subscribe to RSS Feed
- Permalink
07 Feb 2020 02:57 AM
I used Linux as it is the OS I use for work.
- Mark as New
- Subscribe to RSS Feed
- Permalink
10 Feb 2022 01:26 PM
Hi,
Things have changed since 2020 🙂 Now dynatrace produces a json files instead of simple log file. Would you have any tips on how to find out unmonitored processes now ?
Thank you.
Xavier.
- Mark as New
- Subscribe to RSS Feed
- Permalink
28 Mar 2022 07:52 PM
Hey @Julius_Loman, @xap:
- How do we download these zip files?
- How do we download this JSON file?
Thanks!
- Mark as New
- Subscribe to RSS Feed
- Permalink
29 Mar 2022 06:40 AM
Hey brandizzi,
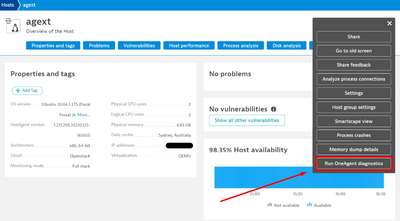
The files in question can be found within the support archive which you generate from the hosts page within Dynatrace. To generate them head over to the host page for the host you wish to look deeper into and select "Run oneagent diagnostics". This can be found within the menu in the top right of the hosts page.
Once there, give a reason for creating the support archive and then start the process. It will take some time but once it is complete there will be an option to download and in the files downloaded you will find all sorts of information regarding your environment.
- Mark as New
- Subscribe to RSS Feed
- Permalink
08 Apr 2022 09:29 PM
Ah, excellent! Thank you so much, Fin!
- Mark as New
- Subscribe to RSS Feed
- Permalink
29 Mar 2022 09:20 PM
Nice tricks, thank you Fin
- Mark as New
- Subscribe to RSS Feed
- Permalink
10 Apr 2022 04:37 AM
Is there way to get processesSnapshot.log to see some details of "Other" process as Dynatrace has stopped generating this log file under support archive instead its generating only json file.
Thanks,
Sujit
- Mark as New
- Subscribe to RSS Feed
- Permalink
24 May 2022 11:01 AM
Hi @xap, @brandizzi, @Fin_Ubels, @julien_duhamel1 and @Sujit,
"Other processes" have rather unfortunate name. It isn't metric of other (aka not reported) process group instances, but rather "everything else" than reported PGIs.
So it can be CPU used by kernel, memory used for some caches or CPU/memory resources shared between different VM (so called ballooning).
At the moment Dynatrace doesn't show those information. So I would have request for you: please create RFE and upvote it so would get traction. Or if someone already created one, please upvote that. Our PMs are deciding priorities of which functionalities implement first based on your votes.
Best Regards
Mateusz
- Mark as New
- Subscribe to RSS Feed
- Permalink
24 Nov 2022 03:30 PM - edited 24 Nov 2022 03:32 PM
It's rather sad to have to setup a RFE for such basic information. Any OS admin that comes to us requesting information about would leave disappointed when we tell them we have to extract a support archive and dig there to find and a not very cheap softare does not display it out of the box.
Sadly very often the infrastructure admins are the ones that are interessted in Dynatrace and it's also the most people we have to disappoint. It clearly has it strengths in terms of web applications though.
Featured Posts

