- Dynatrace Community
- Ask
- Open Q&A
- What Does Dynatrace Consider as Reclaimable Memory on a Host?
- Subscribe to RSS Feed
- Mark Topic as New
- Mark Topic as Read
- Pin this Topic for Current User
- Printer Friendly Page
- Mark as New
- Subscribe to RSS Feed
- Permalink
19 Sep 2019
02:52 PM
- last edited on
28 Nov 2025
08:25 AM
by
![]() IzabelaRokita
IzabelaRokita
Summary: Reclaimable memory refers to memory that can be freed by the operating system without impacting running processes. This thread explains how Dynatrace calculates reclaimable memory and why it matters for capacity planning and performance optimisation.
According to documentation
Memory used
Percentage of total RAM used by processes. RAM used by system caches and buffers isn't included in this metric. Dynatrace calculates memory usage as:memory_used = total_memory_size - (free_memory + active_memory + inactive_memory + reclaimamble_memory)
What does Dynatrace consider reclaimable memory?
We are having and instance where the cached memory is considered as memory used, whereas the actual process memory is 20%.
Any ideas on correcting/setting changes
Thanks
Moses
Solved! Go to Solution.
- Mark as New
- Subscribe to RSS Feed
- Permalink
19 Sep 2019 03:52 PM
Have you seen this blog post ? It explains it pretty well.
- Mark as New
- Subscribe to RSS Feed
- Permalink
03 Oct 2023 02:34 PM - edited 03 Oct 2023 02:35 PM
Hi Folks,
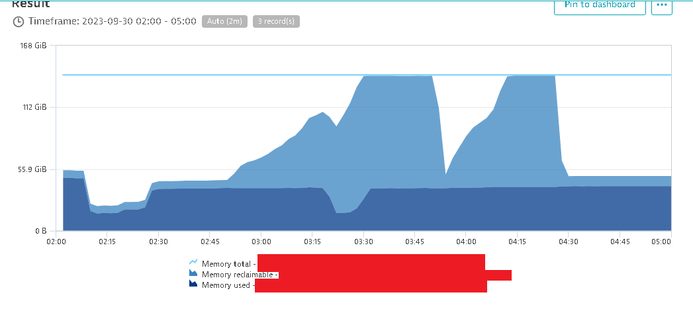
Have you seen such a memory pattern? Do you thnik it is a memory leak in a jvm?
I could not recognize any process which is responsible for this pattern.
Thanks in advance for your help.
Best regards,
Mizső
- Mark as New
- Subscribe to RSS Feed
- Permalink
05 Dec 2023 08:44 PM
The rise does not surprise me, as the OS will typically use available RAM to cache mainly disk access. What does surprise me are the sudden drops, as there seems to have been no restarts. We would probably need a little bit more context though to understand it, namely the OS 😉
- Mark as New
- Subscribe to RSS Feed
- Permalink
15 Dec 2023 01:45 PM
Hi @AntonioSousa,
It was linux RHEL 7.x, but since that it was upgraded to 8.x. Unfortunately the client dt system will not accessible anymore, so I will not be able the check the memory consumption of the host... 😞
Best regards,
Mizső
Featured Posts

