- Dynatrace Community
- Ask
- Open Q&A
- What does it mean if a host has below 100% connectivity?
- Subscribe to RSS Feed
- Mark Topic as New
- Mark Topic as Read
- Pin this Topic for Current User
- Printer Friendly Page
- Mark as New
- Subscribe to RSS Feed
- Permalink
21 Feb 2018
01:42 PM
- last edited on
28 Sep 2022
11:57 AM
by
![]() MaciejNeumann
MaciejNeumann
Hi,
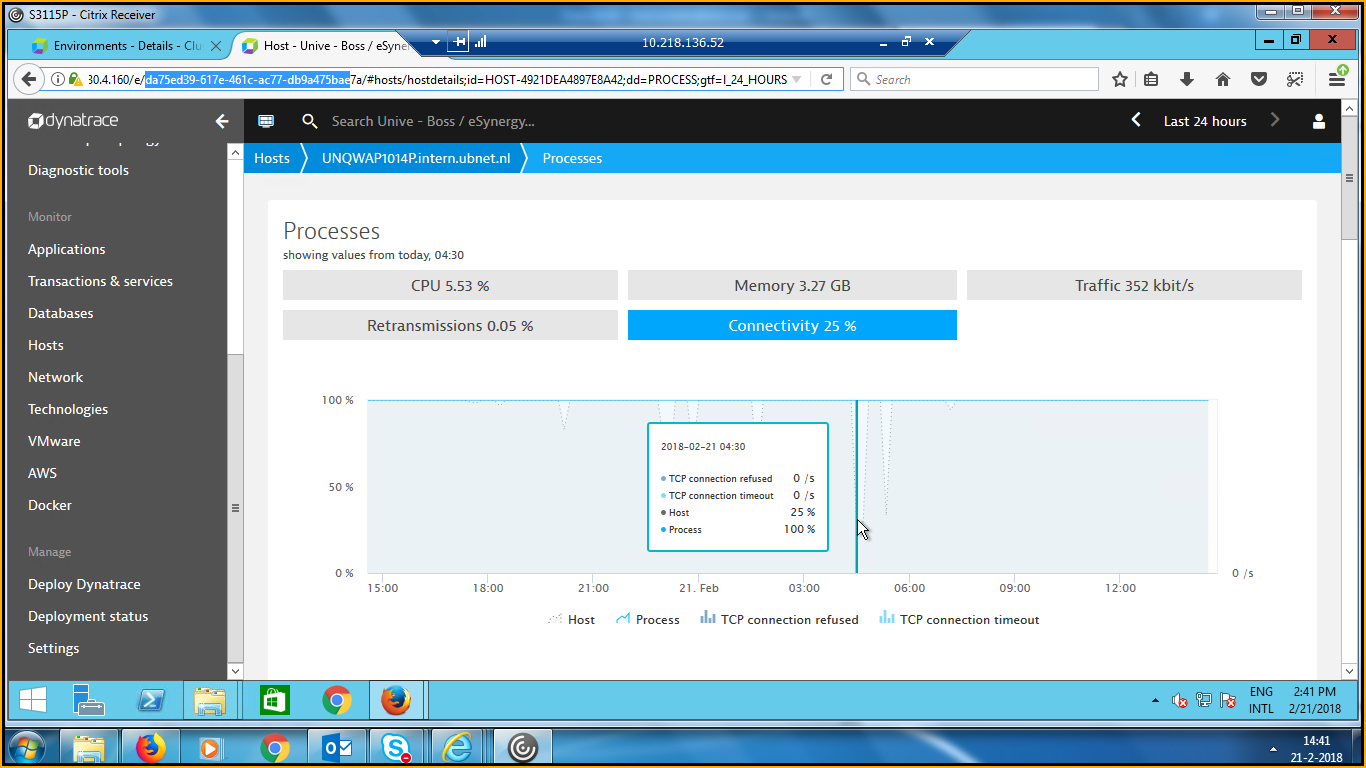
The host has a connectivity below the 100%, I can not find any cause. All processes are on 100% connectivity and I do not see any tcp refused or tcp time-out, messages. In other words, no process is affected so why show me this info anyway?
There is also no info in the windows log files,
Below a screen print as example:

KR Henk
Solved! Go to Solution.
- Labels:
-
hosts classic
-
process groups
- Mark as New
- Subscribe to RSS Feed
- Permalink
21 Feb 2018 06:06 PM
From the documentation:
TCP connection time-out errors
Overloaded or poorly configured processes can have trouble accepting new network connections. This results in timeouts or resets of TCP handshakes. Such issues are tracked as TCP connection refused and TCP connection timeout errors.
Dynatrace also compares the number of such errors with the total number of connection attempts to calculate Connectivity metrics—the percentage of connections that have been successfully established. Ideally, Connection metrics are never lower than 100%. Anything less suggests failed user actions that will be obvious to your customers.
- Mark as New
- Subscribe to RSS Feed
- Permalink
21 Feb 2018 07:38 PM
Hi Rocky,
Thx for your reply,
but there are no processes with a low connectivity, only the host (according to dynatrace), and as you can see the system is almost idle,
KR Henk
- Mark as New
- Subscribe to RSS Feed
- Permalink
22 Feb 2018 11:51 AM
Situation described above will happen if some client attempts to make connections to a port that is no longer open by any process on monitored host. According to definition provided above by Rocky, this will result in drop of connectivity (because the TCP sessions are getting rejected).
We calculate this that way, because if it occurs regularly (resulting in larger drop in connectivity) it indicates an actual problem in monitored infrastructure - something is expecting that there is a service exposed on port in question of monitored host. Please note, that in above light minor drops in connectivity are usually not something to worry about, and at least in the attached screenshot we can see, that a connectivity problem was not reported by Dynatrace in this case.
Clearly in such situation it is impossible to assign the rejected sessions to any PGI (as most likely they are reaching to a process that no longer exists or at least does not have the expected port open), hence the connectivity is 100% for all PGIs. Note, that we report connectivity problems for PGIs for some time after it disappeared, but after some time it is simply impossible to tell, what PGI is supposed to respond on given port.
We are considering adding a list of calling TCP addresses, that result in drop of host connectivity, but this is a loose idea for now so if you would find it useful, please do not hesitate to create a RFE in that area.
- Mark as New
- Subscribe to RSS Feed
- Permalink
16 Nov 2022 08:14 PM
"We are considering adding a list of calling TCP addresses, that result in drop of host connectivity, but this is a loose idea for now so if you would find it useful"
I didn't see any improvement in this area in dyna. it will be great if we know/see those IP which suffer connection refused. then we can assess its impact and root cause. this still be a grey area in monitoring so far.
I also conn't agree that "light minor drops in connectivity are usually not something to worry about". Due to connection refuse, one connection failure might impact a lot requests, especially in high volume service. sporadic connection refuse may indicate some limit is near or reached such as TCP layer params. if have 4000 pool size limit and observed 4000 or more live connections, connection reset will happen and sporadic refuse will be observed.
Therefore, enhancement in the area Connection is very necessary. I indeed has dear need for such metrics or features, at least Total TCP connections should be reported so that I know if it reach TCP limit
Featured Posts
