- Dynatrace Community
- Ask
- Open Q&A
- What does it mean if my host have no lines connecting it?
- Subscribe to RSS Feed
- Mark Topic as New
- Mark Topic as Read
- Pin this Topic for Current User
- Printer Friendly Page
- Mark as New
- Subscribe to RSS Feed
- Permalink
12 Sep 2022
04:38 PM
- last edited on
13 Sep 2022
08:36 AM
by
![]() MaciejNeumann
MaciejNeumann
2 of my hosts is isolated at smartscape topology, what does it mean? is it the reason when I clicked on analyze process connection on both hosts, the page is showing "your processes on this host are not communicating"?
Solved! Go to Solution.
- Labels:
-
getting started
-
hosts classic
-
smartscape
- Mark as New
- Subscribe to RSS Feed
- Permalink
13 Sep 2022 08:05 PM
Hello 👋, and welcome to the community
No connecting lines indicate that there are no hosts that communicating with your hosts directly within the last 72H.
Ensure that there is traffic to other monitored hosts with OneAgent deployed or in additon, deployed to the Proxy hosts
I hope this helps you 😁!
- J
- Mark as New
- Subscribe to RSS Feed
- Permalink
14 Sep 2022 09:54 AM
Hi Joe, thank you for your feedback.
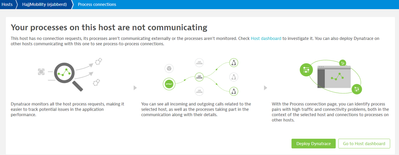
Can you explain more about the statement "This host has no connection requests, its processes aren't communicating externally or the processes aren't monitored. Check host dashboard to investigate it. You can also deploy Dynatrace on other hosts communicating with this one to see process-to-process connections." Perhaps with examples or cases when this page will be showed?
because I was expecting some kind of graphic, please find attached (just that this host is communicating with other host, not the current host I was talking about)
Any enlightenment would be much appreciated, thanks!
- Mark as New
- Subscribe to RSS Feed
- Permalink
15 Sep 2022 09:35 PM
Hi,
The lines just indicates the real-time data connections whether they are incoming/outgoing and it is basically how Dynatrace displays the connections.
- Solid lines represent active relationships between processes, services, applications, and hosts.
- Dotted lines indicate that no activity has occurred for two or more hours.
After seventy-two hours of inactivity, lines are removed from the Smartscape.
Here's more information about that
Dynatrace is able to plot this information and show connected hosts based on an established TCP/IP traffic between each other monitored hosts with OneAgent .. in this case we're looking at the process level communication.
Is very important to know that the most important processes to your environment are
included in the process topology.
Once your monitored Host/process talks to another monitored Host/process, it will then show as connected (lines)... One important thing to consider on this screen, is that the connection ages out and is no longer shown in the Smartscape if the connection has been INACTIVE for more than 72 hours or if it hasn't received any traffic during the last 72 hours.
More information about the Smartscape and its fullstack layers (Application, Services, Processes, Host) is in the documentation with the link I provided.
*Displaying connection lines (Application and Services) is a bit different, but it is stated in the documentation also.
As an extra resource, I'd recommend you to head on to our Dynatrace University to watch short videos of specific topics..
Here's one I found about "Exploring Smartscape"
I hope this information helps clarify a little bit.
"D"
Featured Posts


