- Dynatrace Community
- Ask
- Open Q&A
- Re: XMS and XMS jvm values in dynatrace
- Subscribe to RSS Feed
- Mark Topic as New
- Mark Topic as Read
- Pin this Topic for Current User
- Printer Friendly Page
- Mark as New
- Subscribe to RSS Feed
- Permalink
05 Jan 2023
11:01 PM
- last edited on
09 Jan 2023
09:35 AM
by
![]() Ana_Kuzmenchuk
Ana_Kuzmenchuk
Hi All,
Please help me with one query. For the JVM metrics under the process group screen, what do "maximum", "used" and "committed" memory denote for the heap area graph? Does Xmx value refers to "Committed memory" or is it "maximum memory" in those graphs?
I wanted to check from dynatrace what is the xmx value set for that service, and I am not clear whether it refers to "committed" or "maximum" shown under the graphs for eden, OldGen.
Please advise.
Solved! Go to Solution.
- Labels:
-
jvm
-
process groups
- Mark as New
- Subscribe to RSS Feed
- Permalink
06 Jan 2023 08:58 AM - edited 06 Jan 2023 08:58 AM
Hi @Jigeesha_Gupta ,
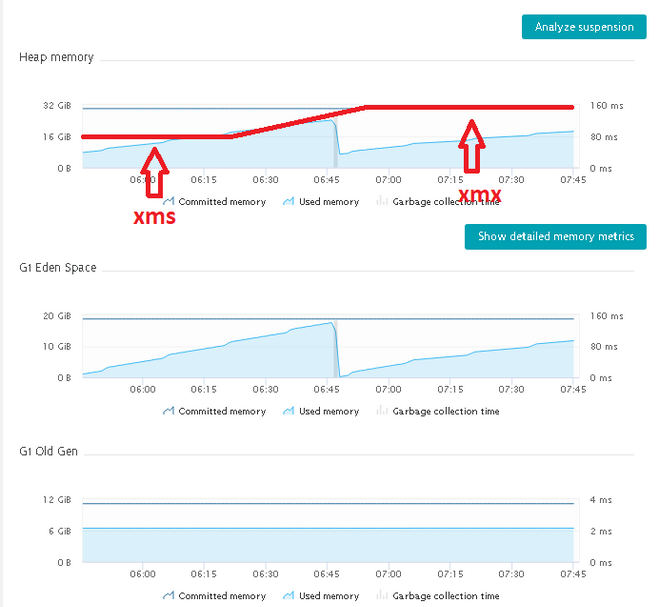
I think the committied memory = xmx (and xms). In my enviroments at different clinets xms = xmx, but if it would be different I would see similar to the red line below.
You can check the process java start parameters at the command line args line (process properities and tags).
I hope it helps.
Best regards,
Mizső
- Mark as New
- Subscribe to RSS Feed
- Permalink
06 Jan 2023 03:44 PM
Thanks @Mizső ...this really helped. One more query please. I also see third legend "maximum memory" in my graphs (both for young and old Gen). What does that signify? I searched a lot, but could not get an answer for it. Please help. I have marked it in the below screenshot:
- Mark as New
- Subscribe to RSS Feed
- Permalink
09 Jan 2023 12:13 PM
Hi @Jigeesha_Gupta ,
Sorry, I think I was wrong. Check this:
Difference in Used, Committed, and Max Heap Memory | Baeldung
So the max in your example is the xmx in the jvm detailed features.
On the process base page max is not presented only the commited and used...
But commited can be very close to max.
Best regards,
Mizső
Featured Posts


