- Dynatrace Community
- Ask
- Real User Monitoring
- Data analysis finding
- Subscribe to RSS Feed
- Mark Topic as New
- Mark Topic as Read
- Pin this Topic for Current User
- Printer Friendly Page
- Mark as New
- Subscribe to RSS Feed
- Permalink
21 Apr 2023 07:02 PM
Hello
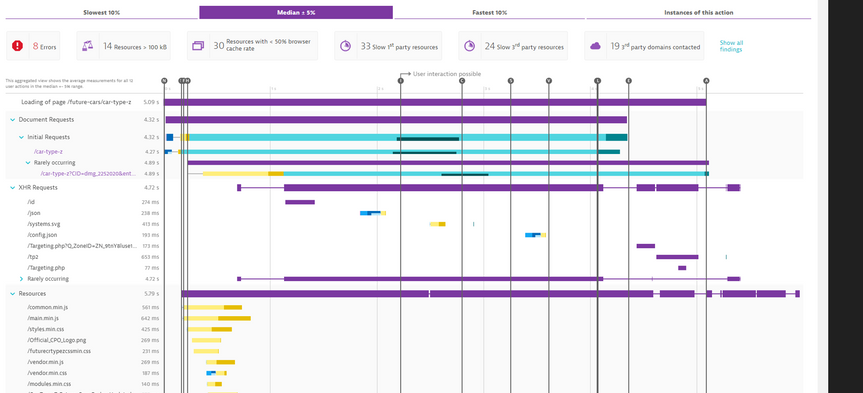
I was wondering if someone could explain the user behaviours on these 2 web user interaction waterfall diagram. I am just curious as it indicates 2 different behaviours. need to double check with my findings.
any small paragraph explaining would be much appreciated.
1
2
Solved! Go to Solution.
- Labels:
-
real user monitoring
-
user sessions
- Mark as New
- Subscribe to RSS Feed
- Permalink
21 Apr 2023 07:27 PM
You are looking at the "median" of waterfalls. Not sure what the two represent, but different browsers/users/time periods?
You might want to look at individual waterfalls first, in the "Instances of this action" tab.
- Mark as New
- Subscribe to RSS Feed
- Permalink
21 Apr 2023 07:47 PM
correct the median. It represent the user interaction on the web but how to make a comparisons between these two charts. what's the main indications in these two waterfall charts of the user behaviour during their visit on web
- Mark as New
- Subscribe to RSS Feed
- Permalink
22 Apr 2023 09:01 AM
Hello @Nidxl
I do not think that there is a way to compare two waterfall analyses. I would recommend having a glance at the below link for more insight especially the Aggregated view and Single instance view.
https://www.dynatrace.com/support/help/shortlink/waterfall-analysis
Regards,
Babar
Featured Posts


