- Dynatrace Community
- Ask
- Real User Monitoring
- Difference between 'Billed' vs 'Unbilled' in DEM Unit Consumption
- Subscribe to RSS Feed
- Mark Topic as New
- Mark Topic as Read
- Pin this Topic for Current User
- Printer Friendly Page
- Mark as New
- Subscribe to RSS Feed
- Permalink
05 Mar 2020
01:58 PM
- last edited on
27 Apr 2021
09:17 AM
by
![]() MaciejNeumann
MaciejNeumann
I draw a custom chart that shows session of all web application.
In the legends down there, I see almost half are 'unbilled' and other half 'billed'. Despite all application have their RUM turned-on and are set to capture 100% of the user sessions.
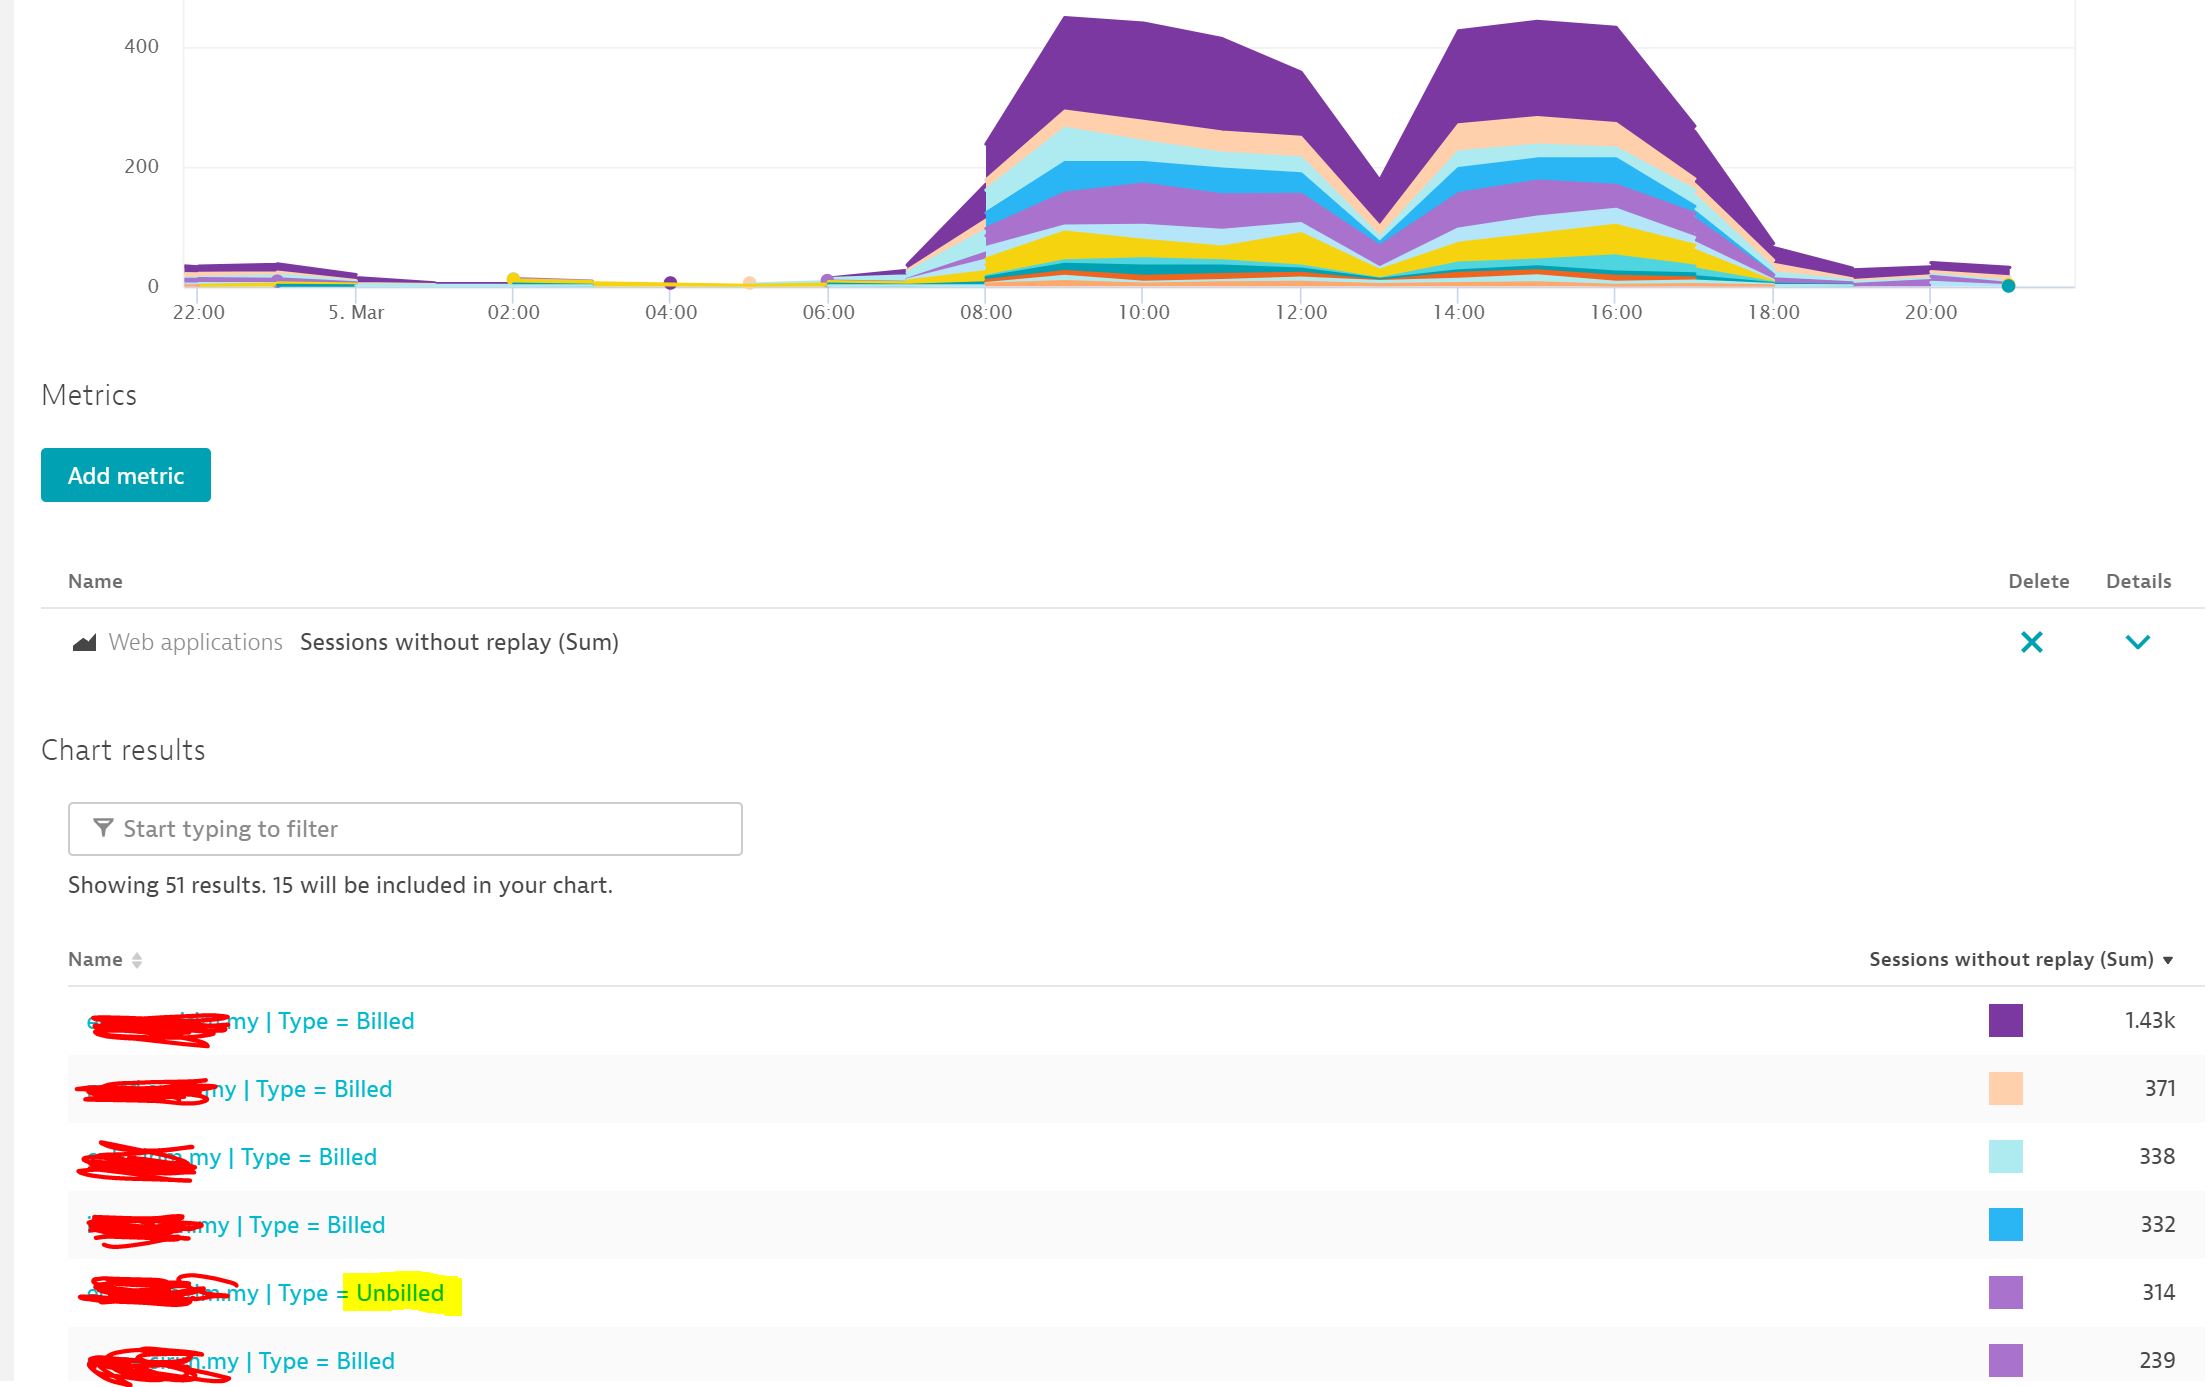
What exactly is the difference between 'Billed' vs 'Unbilled'?
Best Regards,
Wai Keat
Solved! Go to Solution.
- Labels:
-
licensing
-
real user monitoring
- Mark as New
- Subscribe to RSS Feed
- Permalink
05 Mar 2020 03:05 PM
User Sessions that are considred as bounced (only one user action for the entire session) are not billed.
Thus you might have a lot of unbilled user session even if Real User Monitoring is turned to 100%.
The unbilled User Sessions are still captured but not counted against your DEM unit consumption.
- Mark as New
- Subscribe to RSS Feed
- Permalink
05 Mar 2020 05:02 PM
Also note that the 'Billed' amount does not take into account how the session was consumed. For RUM, it would be .25, for example. In your chart the 1.43k Billed would actually consume 357.5 DEM licenses. The same applies if you use the API to query the Billing metrics, you have to do the math to figure out how many actual licenses you are consuming. For me, the current state of Billing metrics, while better than nothing, leaves a lot to be desired, especially if you are trying to forecast how long your license pool will last.
- Mark as New
- Subscribe to RSS Feed
- Permalink
05 Mar 2020 09:18 PM
Agreed! This has been a hot topic for me.
- Host Units - Straight forward.
- Host Unit Hours - Straight forward.
- DEM Units - Nightmare: Needs to be reworked and everything broken out.
- Log Analytics - Don't even get me started, however I believe Dynatrace is fixing this one.
- Mark as New
- Subscribe to RSS Feed
- Permalink
06 Mar 2020 08:31 AM
Actually I don't think DEM units are so difficult to report on usage. But they are difficult to predict for budgeting reasons. Before those billing metrics were introduced it was really difficult.
Also with DEM you may have sessions that continue in another session (after 200 actions) that are not counted towards DEM.
- Mark as New
- Subscribe to RSS Feed
- Permalink
06 Mar 2020 02:26 PM
I also find the DEM Units pretty straight forward.
A better estimated overview in the UI on how long they last with the current consumption would be appreciated though.
- Mark as New
- Subscribe to RSS Feed
- Permalink
06 Mar 2020 03:42 PM
The worst thing about DEM units is the sales side. It's quite complicated to do a budgetary estimation, especially for a new environment.
With log/custom metrics it's almost impossible.
- Mark as New
- Subscribe to RSS Feed
- Permalink
09 Mar 2020 02:28 PM
More of my headache around them is the lack of controls over what entities and / or the owner of said entities can use consume how much of the licensing pool total.
- Mark as New
- Subscribe to RSS Feed
- Permalink
09 Mar 2020 02:31 PM
Well if you operate Dynatrace as a service provider within your organization and you share tenants between teams, then I really understand your concerns :-(.
- Mark as New
- Subscribe to RSS Feed
- Permalink
09 Mar 2020 03:05 PM
Qutoas for management zones would be nifty sometimes yes 🙂
- Mark as New
- Subscribe to RSS Feed
- Permalink
09 Mar 2020 08:14 PM
BIG TIME AGREE! 🙂
In fact, that was one of the things I really expected to see when they came out with Management Zones. I am not sure Management Zones have been used or even enhanced in the way first thought. It seems like these have become used more as filters than what I would consider a "Management Zone". I get really stuck on terminology 🙂
When I hear "Management Zone", that is one of the first things I think of is the ability to do just that... Manage that zone in terms of granular permissions and licensing consumption.
- Mark as New
- Subscribe to RSS Feed
- Permalink
09 Mar 2020 07:21 PM
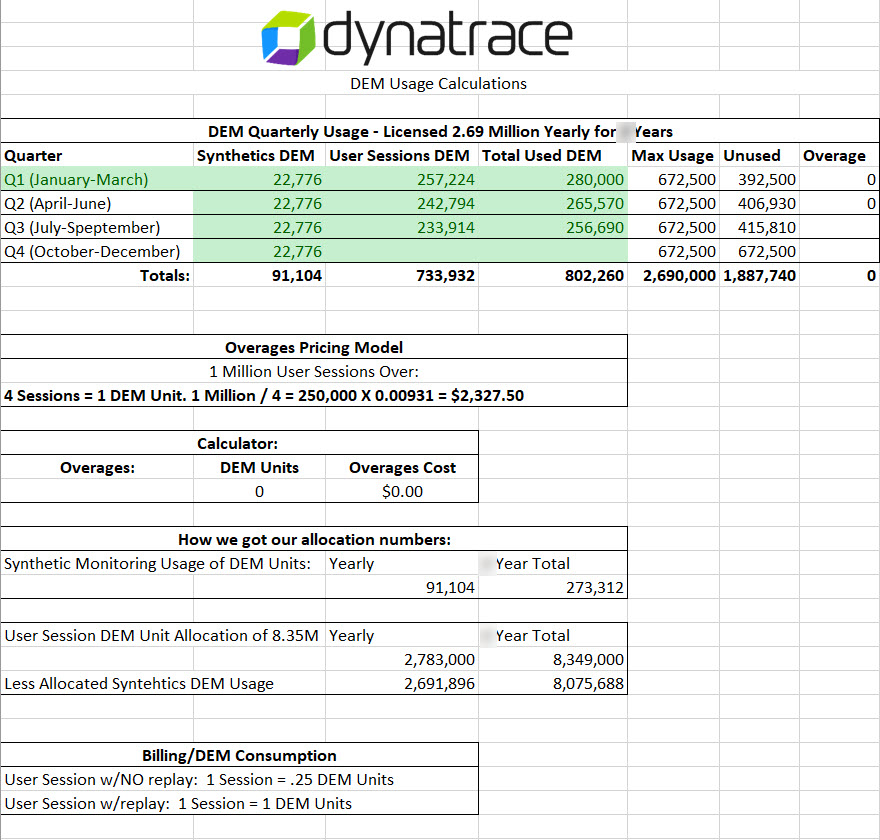
DEM units arnt too bad. The biggest thing is to review your contract and get a clear understanding of the consumption and overages. Session replay uses 1 DEM where Non Replay uses 1/4.... so put that into dollars. ! dollar for session replay per session, No session replay is 25 cents, and 1 DEM per 4 sessions. Use excel to keep track of this all. We run a monthly report where we capture all the data.
Application User sessions per month:
 Also forecasts the increased cost if we had Session Replay turned on.
Adding Synthetics and User Sessions to the overall usage of DEM :
Quick Overview of the usage as a whole:
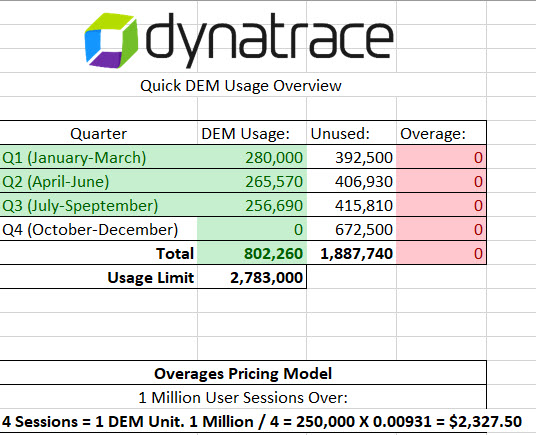
The beauty of DEMS is that if we end up decommissioning an application that has synthetic monitors, then we regain those DEM units to use towards User Sessions that might be over thus reducing our end of the year costs.
- Mark as New
- Subscribe to RSS Feed
- Permalink
05 Mar 2020 11:03 PM
Nice topic for me too. I'm trying to put together DEM and HU usage by applications in order to monitor consuming and be able to forecast consume.
No way 😞
- Mark as New
- Subscribe to RSS Feed
- Permalink
09 Mar 2020 03:04 PM
Why not? You can pull all the necessary information via the metrics API, you just have to do the calculation for DEM or Host Units yourself, but that can be done with a simple script.
- Mark as New
- Subscribe to RSS Feed
- Permalink
09 Mar 2020 08:32 PM
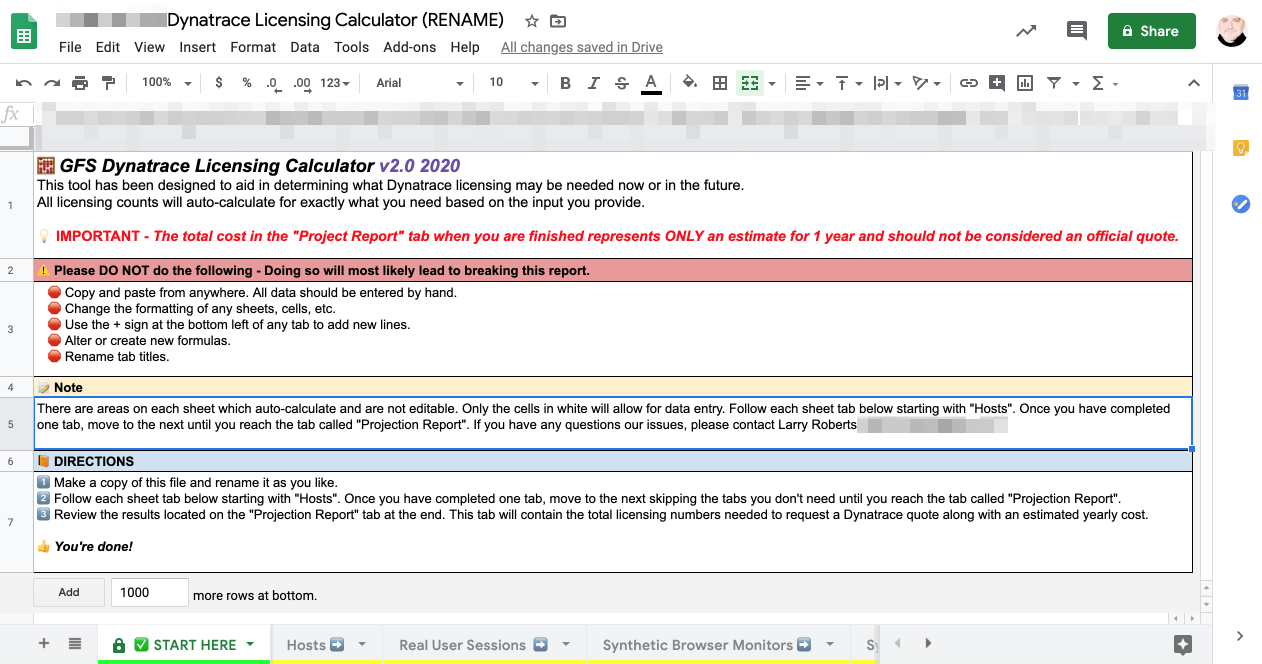
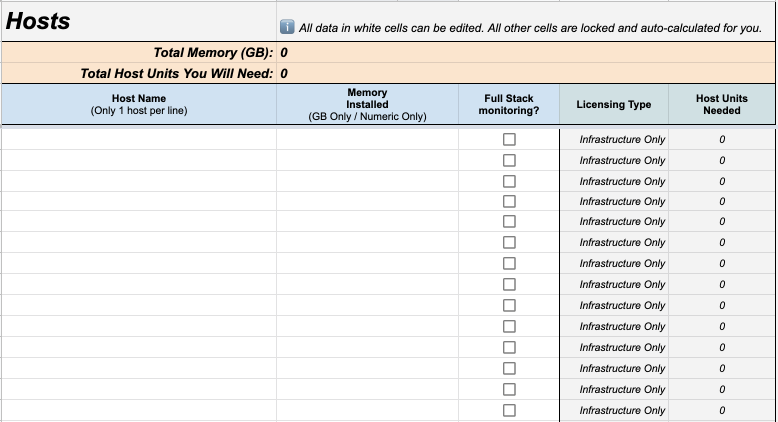
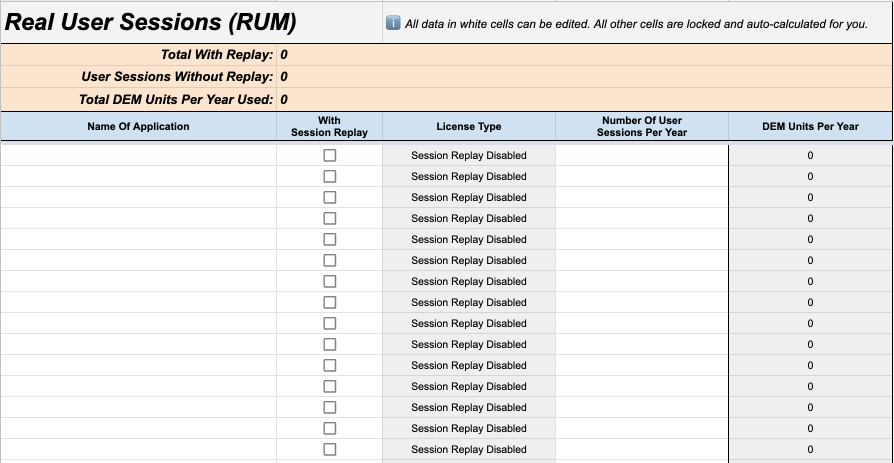
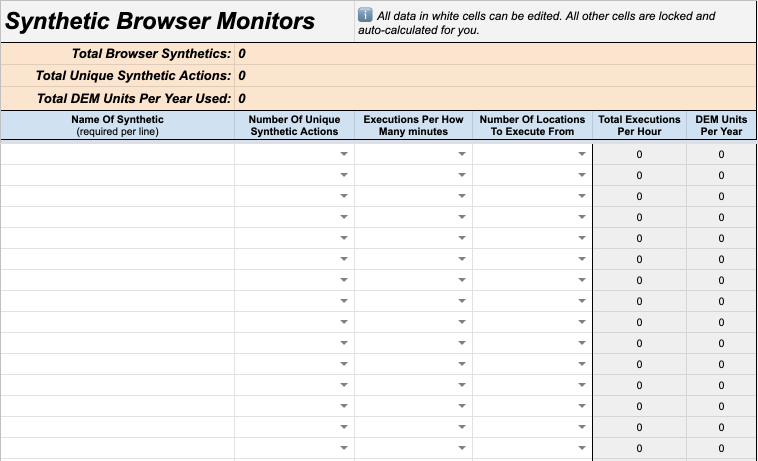
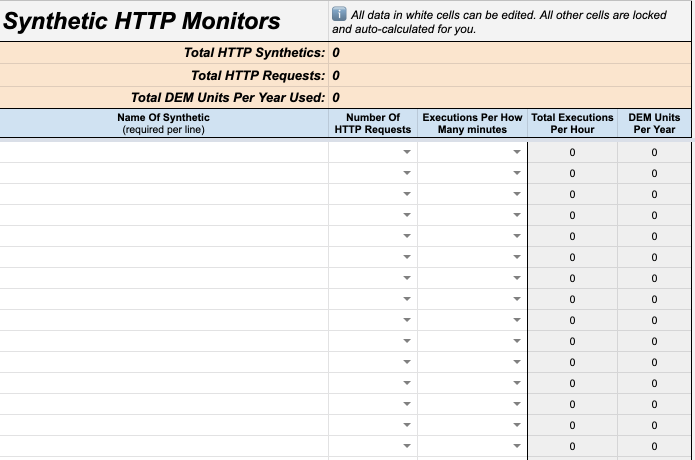
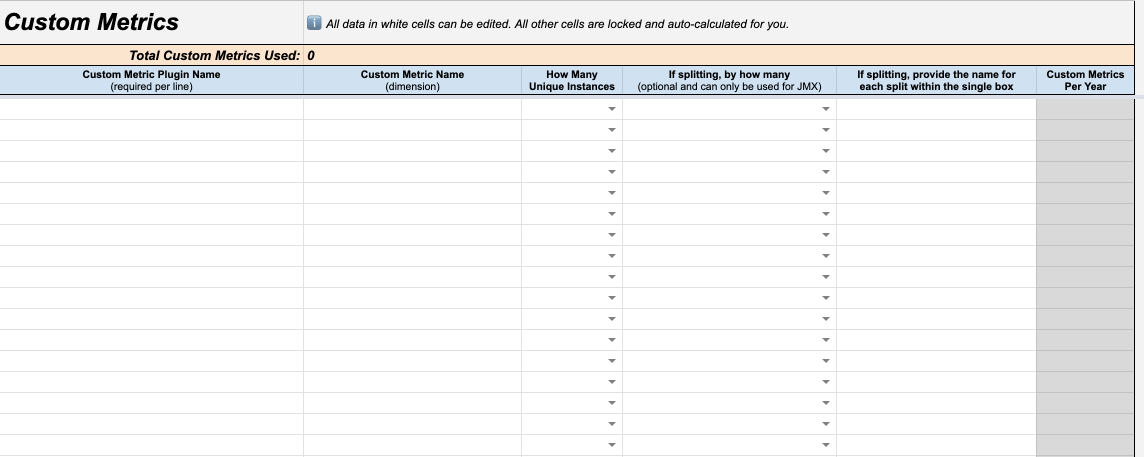
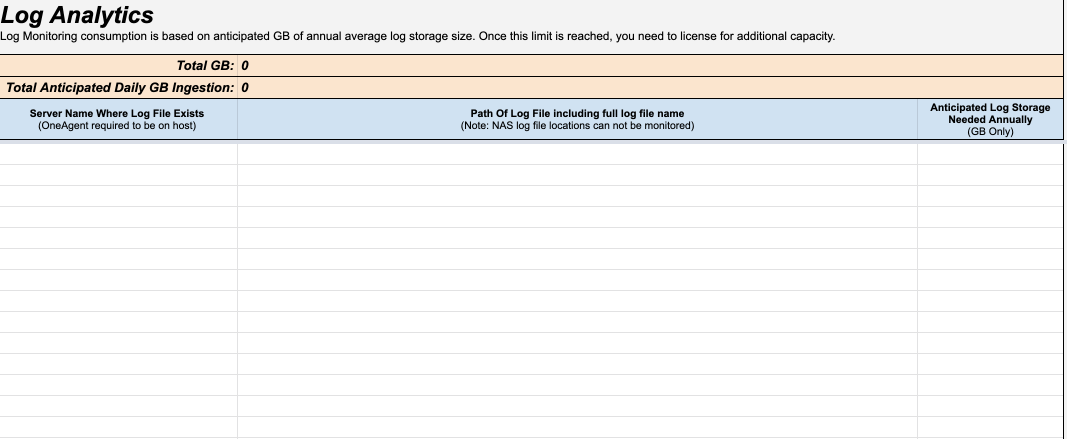
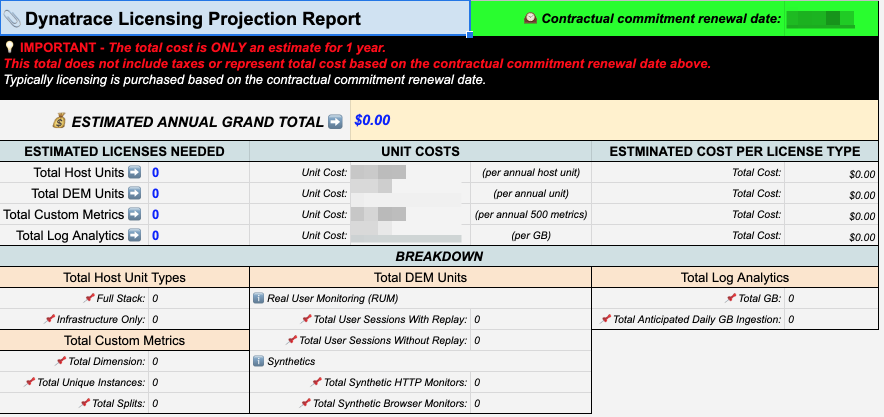
Good stuff @Chad T. That is exactly what I have been doing with Google Sheets since we are a Google shop. In fact, I have build what we call the "Dynatrace Licensing Projection Report" to aid teams in figuring out exactly what they need and an estimate on annual cost. When something new needs to go into Dynatrace, this is the first step teams do is click a link within our internal documentation on Confluence when then makes a copy of this for them to fill out. This is based off a configuration screen with numbers taken from our contract. Everything is setup to auto-calculate for them based on the information provided via a final report. They just go tab to tab to tab until they reach the last tab which is the final report.
This does not include a forecast which is something I am working on now to try and better project for our environment. Also, this is my second version of this so there is some tweaking I am currently doing to it, but it gives the basic idea.
Again however... Most of my frustration comes from the lack of controls of who, when, what, can consume any parts of the licensing pool.
Featured Posts
