- Dynatrace Community
- Ask
- Real User Monitoring
- Drill down to Purepath NOT available for Android App
- Subscribe to RSS Feed
- Mark Topic as New
- Mark Topic as Read
- Pin this Topic for Current User
- Printer Friendly Page
Drill down to Purepath NOT available for Android App
- Mark as New
- Subscribe to RSS Feed
- Permalink
07 Feb 2019
07:37 AM
- last edited on
10 Dec 2021
12:34 PM
by
![]() MaciejNeumann
MaciejNeumann
Hi Folks,
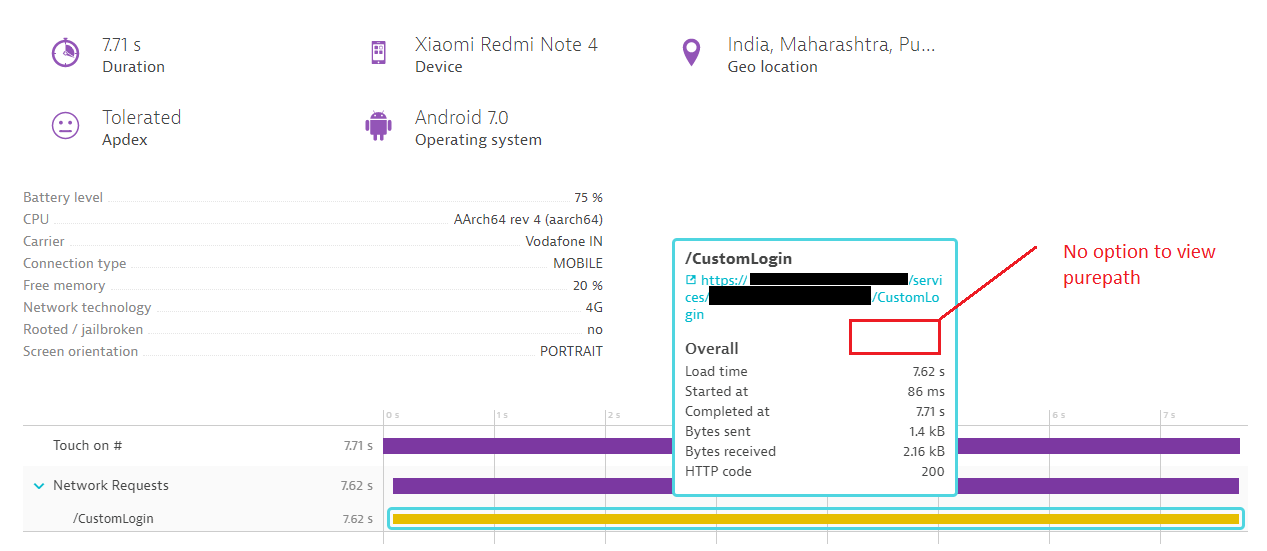
We have instrumented an Android app using Dynatrace Gradle plugin but we are unable to drill down to the pure path of the relevant user actions network request refer below snapshot

Note: We have installed OneAgent in all the servers of the Application
- Labels:
-
android
-
mobile monitoring
- Mark as New
- Subscribe to RSS Feed
- Permalink
07 Feb 2019 08:21 AM
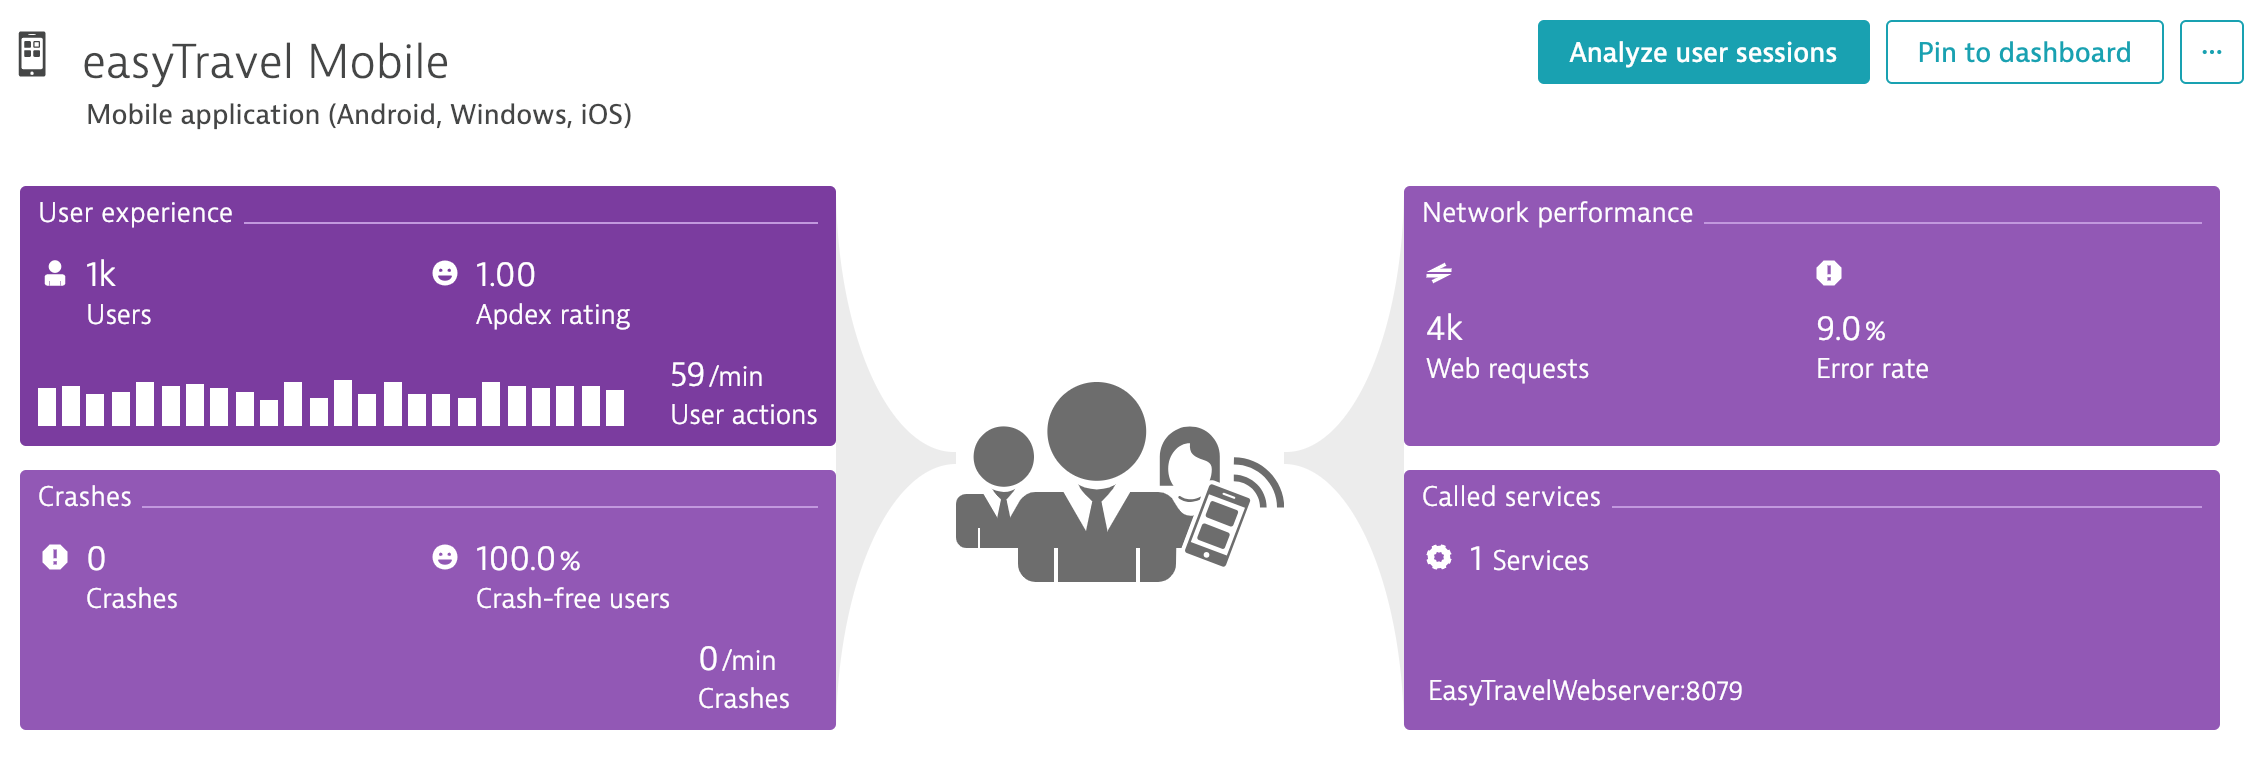
Hello, when you are looking on application view, do you see connected service?

Or there is nothing (right bottom).
Sebastian
- Mark as New
- Subscribe to RSS Feed
- Permalink
07 Feb 2019 08:27 AM
Hi Sebastian,
In called services, I am able to see the web service is getting called and in service flow, I am able to get the complete service flow from App=>Web=>Appserver=>db but not able to drill down from user actions to purepath.
- Mark as New
- Subscribe to RSS Feed
- Permalink
07 Feb 2019 08:38 AM
My application calls to two different application services.
1)Used to validate User details
2) Main application service for rest of the transactions
for the first service, I am able to see the view purepath button to drill down purepath, but for the main service I am not able to drill down to purepath.
- Mark as New
- Subscribe to RSS Feed
- Permalink
07 Feb 2019 08:47 AM
Ok I understand I just wanted to check if dyntatrace is able to tag those user actions. Another test. Go to service that is called by your application, then check backtrace and look at user actions that are responsible for those calls. Then check if you see purepaths on them.
Sebastian
- Mark as New
- Subscribe to RSS Feed
- Permalink
07 Feb 2019 09:13 AM
In backtrace of the called web server service, I am able to see some user actions but not able to drill down to purepath. Also, I observed that in some instance user actions and pure paths are getting stitched but its like only 5-10% of the network requests are getting stitched with pure paths. In backtrace, most of the user actions are in URI form not in the actual user action like "touch on **"
This is unusual as for my other application I am able to see view purepath button for all the network requests.
I have a doubt is this something related to Adaptive capture controle as My application has a throughput of 24.9k/min

