- Dynatrace Community
- Ask
- Real User Monitoring
- Mobile crash stackTrace
- Subscribe to RSS Feed
- Mark Topic as New
- Mark Topic as Read
- Pin this Topic for Current User
- Printer Friendly Page
- Mark as New
- Subscribe to RSS Feed
- Permalink
12 May 2020 08:18 AM
Hi,
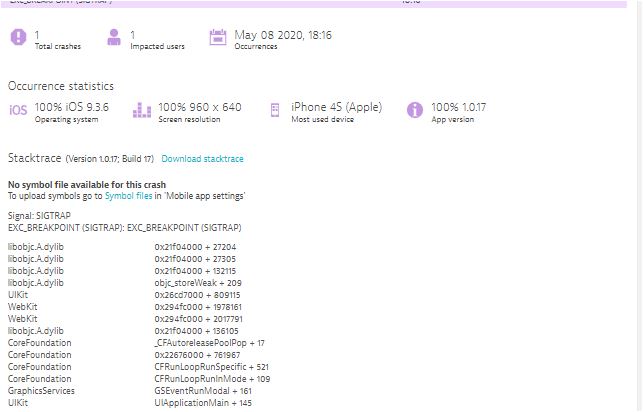
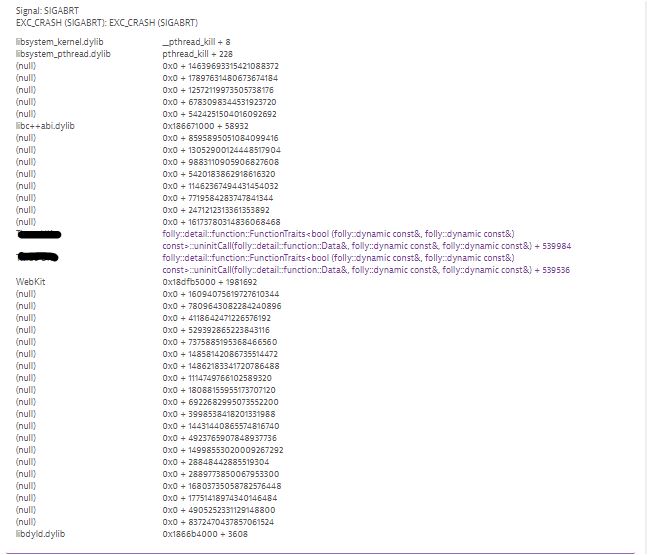
Is there document that describe how to analyse StackTrace of mobile app crash? We have seen number of mobile app crash reported by dynatrace but data captured in StackTrace is not in human readable form. For android traces I can see Exception and line number in few cases but not all and which is very inconsistent.
I am not able to understand how to make sense of this data.
What our team is looking for is Exceptions name and line number of code which is causing the exception/error.
Can anyone guide me how to make use the stackTrace to find the root cause? I have attached images from IOS crash problem.
Image 1

Image 2

Thanks
Suresh
Solved! Go to Solution.
- Mark as New
- Subscribe to RSS Feed
- Permalink
12 May 2020 08:38 AM
currently the Application (purple) frames can be made more readable by uploading symbol files - you can see the link to do so in the screenshots you added. Most important steps are:
• dowload dSYM files for the affected version from AppStore Connect
• process them with DTXDSSClient and upload them with that client or in the webUI
more details can be found here: https://www.dynatrace.com/support/help/how-to-use-dynatrace/real-user-monitoring/how-to-use-real-use...
providing readable frames for system libraries is currently on the roadmap and will show readable lines for the system library frames then.
- Mark as New
- Subscribe to RSS Feed
- Permalink
12 May 2020 09:18 AM
Thanks @Patrick H. I am not mobile app developer so I am trying to understand the whole concept. When I talk to my developer they don't know about Symbol files. Few queries
What is symbol file and how to generate this? Does it require development efforts .
From where we can download Symbol file and Progaurd file.
What level of detail I will get if we upload the symbol files? Does it give details of source code line where exception/error triggered
- Mark as New
- Subscribe to RSS Feed
- Permalink
13 May 2020 09:44 AM
When code is compiled, the names of methods, file names, line number are no longer readable. For Android an obfuscation process is common, this means that method names are made unreadable to prevent re-engineering of the application package and this is done with ProGuard.
To be able to go back to clean method names, file names and line numbers, mapping or symbol files are required. They are an output of the compilation process and in the case of iOS they can not be taken directly from the development machine, but must be downloaded from App Store Connect.
If those mapping or symbol files are uploaded to Dynatrace (this must be done every time a new version is released in the app stores of Google or Apple), then the part of the stack traces that is code from your application will be clearly readable (method name, file name, line number). Parts of system libraries might still be unreadable, in most cases they're not helpful anyway. So, yes, the source code line where exception/error is triggered will be visible.
- Mark as New
- Subscribe to RSS Feed
- Permalink
15 May 2020 07:16 AM
Thanks @Thomas B. this is really helpful.
- Mark as New
- Subscribe to RSS Feed
- Permalink
04 May 2023 08:15 PM
Can you help me how to process symbolic file with DTXDSSClient , i downloaded DTXDSSClientbut not able to enter any command
Featured Posts
