- Dynatrace Community
- Ask
- Real User Monitoring
- SLO definition for the count of KeyUser actions speed
- Subscribe to RSS Feed
- Mark Topic as New
- Mark Topic as Read
- Pin this Topic for Current User
- Printer Friendly Page
SLO definition for the count of KeyUser actions speed
- Mark as New
- Subscribe to RSS Feed
- Permalink
24 Jun 2022 10:36 AM
Similar to the SLO approach of service-side key requests, where one can create a metric to count the NUMBER of requests that are below/above a certain duration, I wanted to also follow the same approach for client-side key user actions.
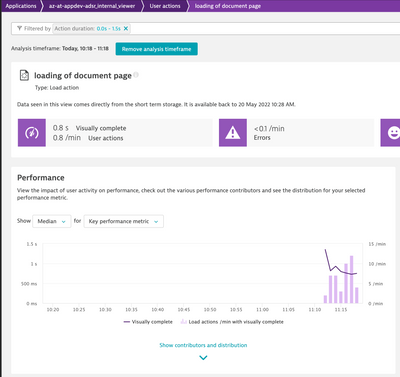
Although you can do this kind of "action duration" filter in the user action analysis screen you cannot create a metric off it like for service key requests:
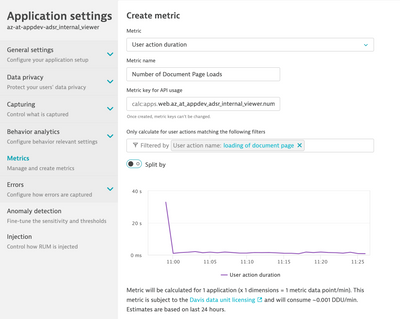
Another approach would be to create an Application Metric that would count the number of requests of a specific user action, however this is also not possible, only time based metrics (no counting) for user actions are available:
This concludes that one cannot create an SLO specific for a key user action count, but would need to revert to a APDEX only "bucketing" of user actions (using the apdex thresholds and then use the apdex category in the SLO query/metrixcs).
Is that assumption correct or has someone come up with another idea?
- Labels:
-
user actions
- Mark as New
- Subscribe to RSS Feed
- Permalink
24 Jun 2022 01:41 PM
Oh my! I found an inconsistency in how Dynatrace handles created custom metrics depending on where you create them.
This is important to know for those who might want to tackle something similar!
When you create a service-based metric (such as key requests or from the multi-dimensional analysis screen), you must select the type of aggregation (e.g. count). This will create ONLY a count metric with no other aggregations, like this one (notice the Aggregations: auto, value😞
However if you create a APPLICATION-based metric (such as key user actions from the user action analysis screen or the application configuration), you must select the type of metric (e.g. user action duration, visually complete,...). Then dynatrace will create the different aggregations (also the count aggregation) for you, like this one (notice the Aggregations: auto, avg, count, max, min, sum):
This is inconsistent and very counter-intuitive. I'd expect this to be done in the same way!
With that said, you can create the SLO definition based on the count of fast/slow/total key user actions, but have to specify the aggregation in the metric query like this (notice the extra count() aggregation:
100*(calc:apps.web.az_at_appdev_adsr_internal_viewer.fastloadingofadsr_viewerdocumentpage:count()/calc:apps.web.az_at_appdev_adsr_internal_viewer.loadingofadsr_viewerdocumentpage:count())
- Mark as New
- Subscribe to RSS Feed
- Permalink
24 Jun 2022 08:42 PM
Yes.. I ran into the very same situation a year ago. Also defining a custom metric for each key user action is ... not very convenient. It's easier to use USQL, if it fits your use case and you accept the USQL limitations.
- Mark as New
- Subscribe to RSS Feed
- Permalink
01 Aug 2024 03:58 PM
Hi @r_weber , when I am trying to create application metric from application settings. I have selectin Action duration and filtered data for page name. I am getting aggregation as "auto, value". Could you please guide how to get "count" aggregation.
Thanks,
Seema


