- Dynatrace Community
- Ask
- Real User Monitoring
- UEM injection works, no UEM metrics (filtered?)
- Subscribe to RSS Feed
- Mark Topic as New
- Mark Topic as Read
- Pin this Topic for Current User
- Printer Friendly Page
- Mark as New
- Subscribe to RSS Feed
- Permalink
06 Dec 2017
03:42 AM
- last edited on
28 Apr 2021
10:20 AM
by
![]() MaciejNeumann
MaciejNeumann
Hi,
We have a WAS Liberty application monitored with Dynatrace Managed on-premise.
Everything works well, except for the UEM response back to the server, it seems to get filtered in the middle by a tier or lack of permissions on the web servers under a particular path.
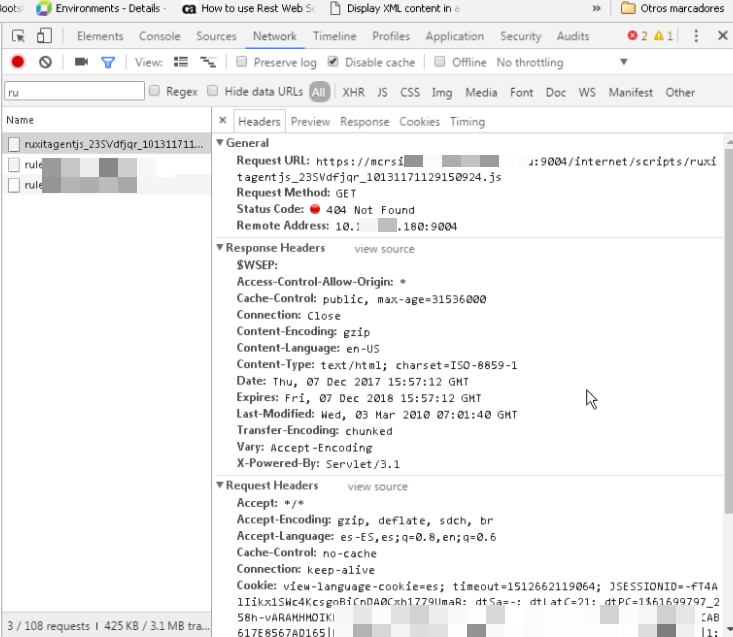
We can see the js injected in the page, but if you look at the example in the image, it gets a 404 HTTP error for the GET to the path.
I wonder if there is a way to either change the response path of UEM on Dynatrace or if we have to enable additional permissions on the web server to allow the GET /internet/...
Any thoughts? It used to be easier on AppMon, perhaps I'm missing a set up or tweak.
There are a couple of nginx servers before the web server and also F5, but these are not filtering anything. i.e. If I hit the web server straight by ip address/url, bypassing F5 and nginx, I get no UEM metrics either.
Bests
Carlos.
Solved! Go to Solution.
- Labels:
-
javascript
-
user sessions
- Mark as New
- Subscribe to RSS Feed
- Permalink
06 Dec 2017 08:38 AM
Yes, you can change multiple EUM parameters such as:
- javascript location
- inject javascript directly (can be also specified per URL rules)
- beacon location
- cookies
etc..
All these parameters are configured on Application entity (choose Application -> Edit -> Advanced Setup) If you do not have application defined or this request does not match any application grouping rules, you have to configure it in the "My web application".
If you are unsure about the application grouping rules (rules for matching URL requests to applications), I'd recommend to reconfigure the javascript location of the default "My web application" to some path like "/mywebapplication/" so you can easily detect if your request matches grouping rules or not.
I have encountered a situation where load balancer was mapping URLs such as https://intranet/app1/ to application server https://appsrv1/ (actually removing the context path) and my grouping rules did not work. After changing the default path for javascript for the default "My web application" I was able to identify my rules did not work (they are applied on the application server and requests appeared as https://appsrv1/ instead of https://intranet/app1/ ) and all requests were mapped to the default application.
- Mark as New
- Subscribe to RSS Feed
- Permalink
06 Dec 2017 02:58 PM
Thanks so much Julius, I'll give it a try later, and let you know how it goes.
Thanks again!
- Mark as New
- Subscribe to RSS Feed
- Permalink
07 Dec 2017 05:08 PM
Hi,
I've tried changing different paths, from the Advanced Set up options, and none of them worked.
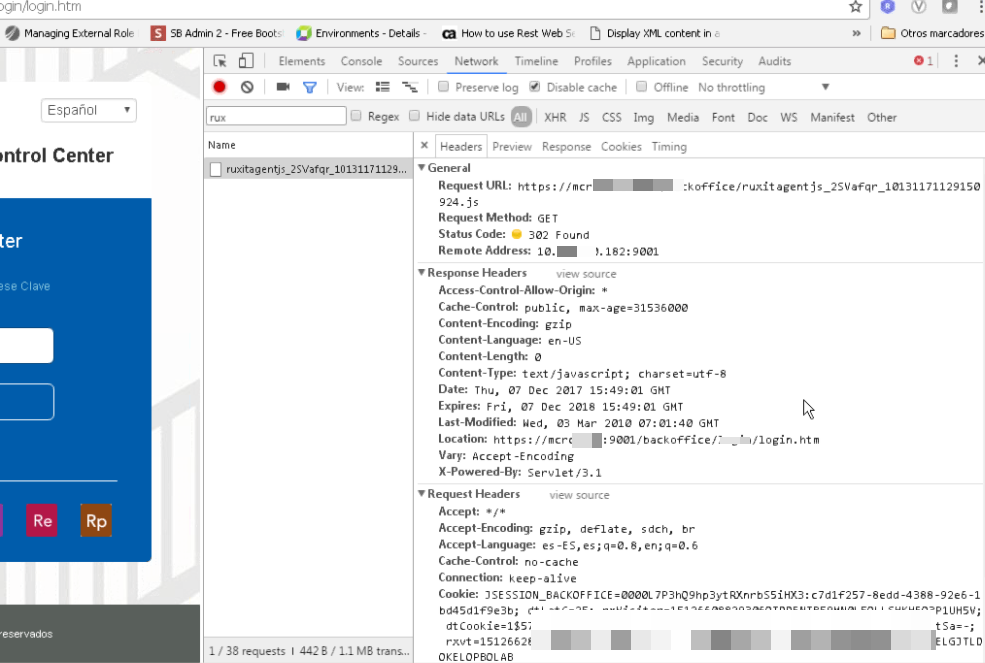
Now, what I did was hit the app server straight through, bypassing the F5, and nginx, and one app server works as expected, see image attached, it returns an http 302, and the other one still shows an http 404 error.


So there is a difference between both servers, any ideas or workarounds?
Thanks in advance,
Carlos.
- Mark as New
- Subscribe to RSS Feed
- Permalink
19 Jan 2018 08:28 PM
We had an issue with the nginx version and missing debug symbols package (nginx was instrumented, but lacking debug symbols), after upgrading an nginx server + debug symblos, we were able to retrieve metrics and visits.
Thanks!
- Mark as New
- Subscribe to RSS Feed
- Permalink
20 Jan 2018 03:35 AM
Hey Carlos,
Just to make sure I understand clearly, are you injecting the JavaScript agent from the app server and then the RUM data is sent back from the user's browser to a web-server that does not have a Dynatrace agent? If there is no oneagent on the web-server and all RUM traffic is sent back there, it would not know what that is so it will drop it and throw a 404 error. Please confirm if the scenario I explained is what is happening.
Thanks
NJ
Featured Posts
