- Dynatrace Community
- Ask
- Real User Monitoring
- Re: Visually complete or DOM split by page
- Subscribe to RSS Feed
- Mark Topic as New
- Mark Topic as Read
- Pin this Topic for Current User
- Printer Friendly Page
- Mark as New
- Subscribe to RSS Feed
- Permalink
18 Oct 2019
08:28 AM
- last edited on
30 Sep 2022
12:13 PM
by
![]() MaciejNeumann
MaciejNeumann
Hi,
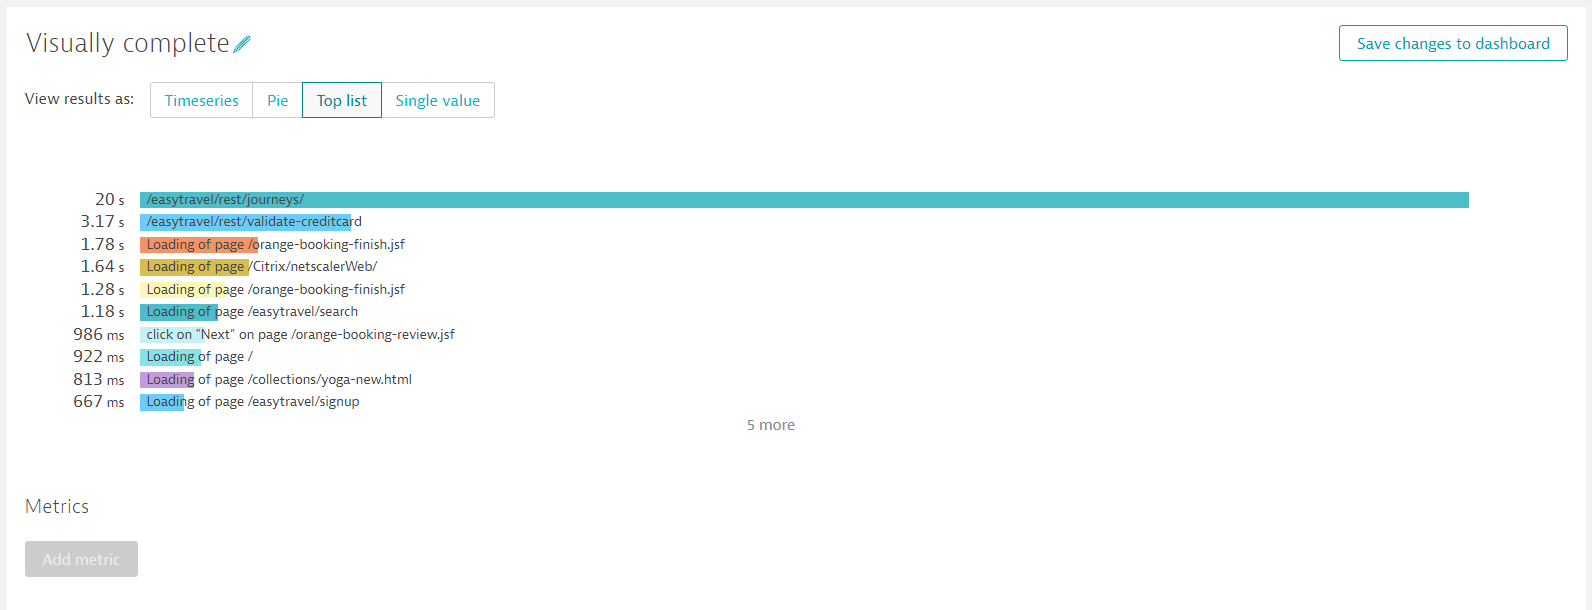
Does anyone know is there some metric in Dynatrace Managed which I could use to split the Visually Complete or DOM that the results would be split by page like on this example?
Our Managed version is 1.178 and couldn't find any Metric which would split the results as landing page so therefore is this something which is coming out on next version or is there some way to accomplish this?

Solved! Go to Solution.
- Labels:
-
user actions
- Mark as New
- Subscribe to RSS Feed
- Permalink
18 Oct 2019 11:11 AM
You should do it using USQL query:
Check something like this:
SELECT name, MEDIAN(visuallyCompleteTime) FROM useraction GROUP BY name
You will get something like this:

Sebastian
- Mark as New
- Subscribe to RSS Feed
- Permalink
18 Oct 2019 12:40 PM
Hi Sebastian,
I started to play around with USQL and thank you for pointing it out.
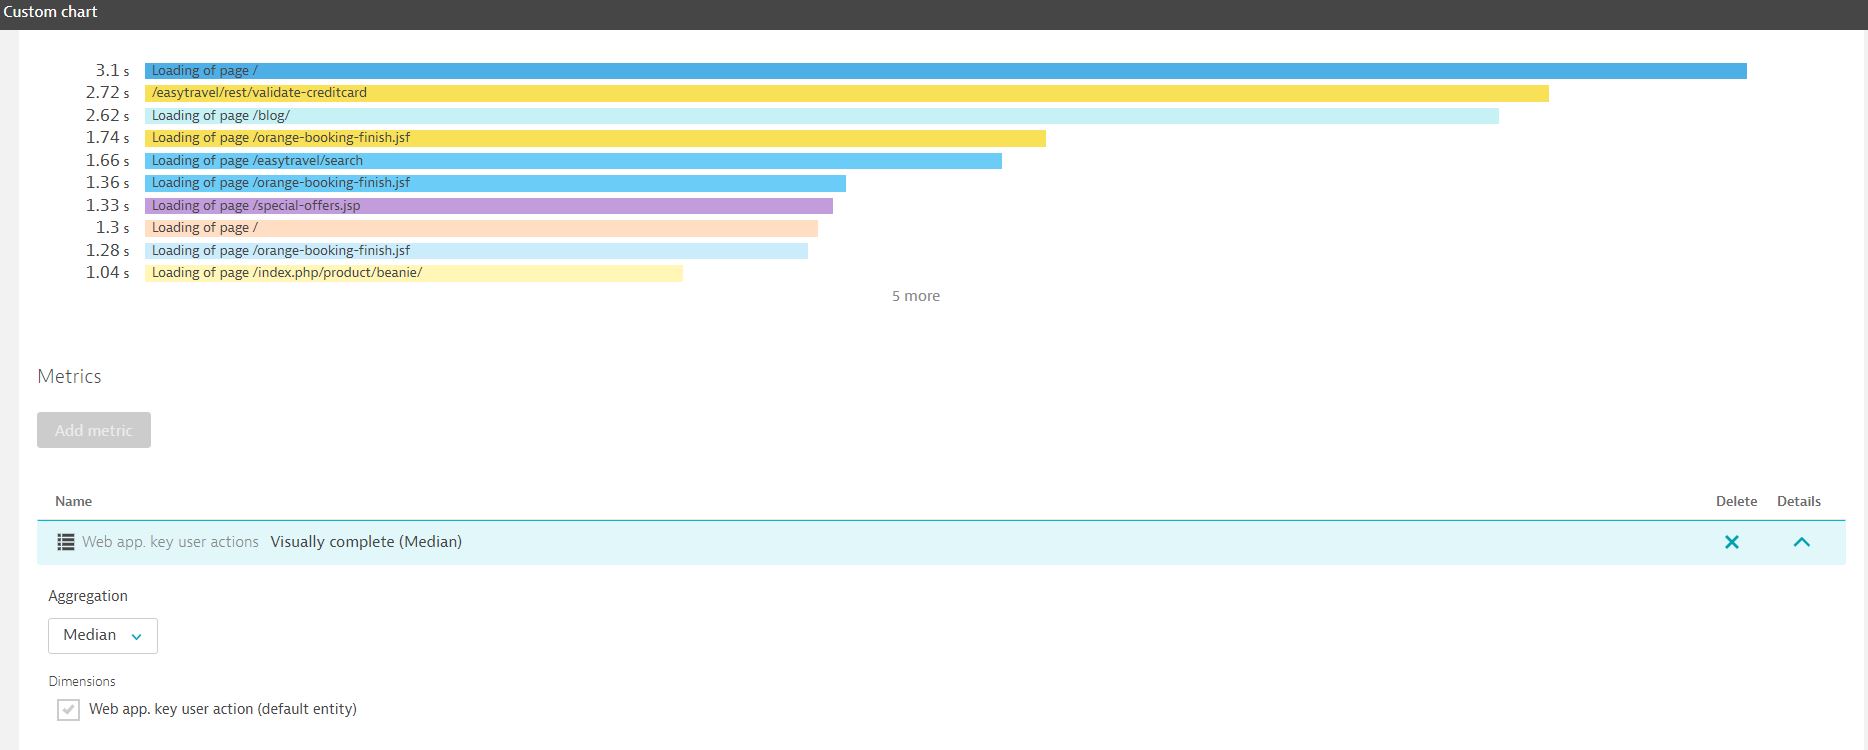
My picture example was actually from demo.livedynatrace.com and seems that there is already some metric available called Web app. key user actions Visually complete (Median) which we could use to make top list of key user actions on custom chart.
Just couldn't find any similar from our Managed environment (running on 1.178.118.20191015-125616) and not sure what I'm missing out since seems that I can't sort the result by key request and it's little but confusing if I'm missing out something or those metrics are just coming to Managed in some point?
Br,
Janne
- Mark as New
- Subscribe to RSS Feed
- Permalink
18 Oct 2019 01:37 PM
For key user actions there arę metrics available on dashboards. But if you want to see all user actions (you should mark only important ones as key user actions) you should use USQL.
Sebastian
- Mark as New
- Subscribe to RSS Feed
- Permalink
18 Oct 2019 02:37 PM
I just don't get this. What ever Key User Action metric I try on our Managed Environment I can't get our key user actions listed by name so therefore so don't know if the live.demo.dynatrace.com differences somehow from our Managed environment.
Would be nice to know what metric is actually used on this Application Dashboard since what ever Key Request metric I can't get the actions listed by name like on this example.
The USQL part works partly but the generated graph is not so useful than on the top list and couldn't get any "links" to actual user actions from it.

- Mark as New
- Subscribe to RSS Feed
- Permalink
18 Oct 2019 08:00 PM
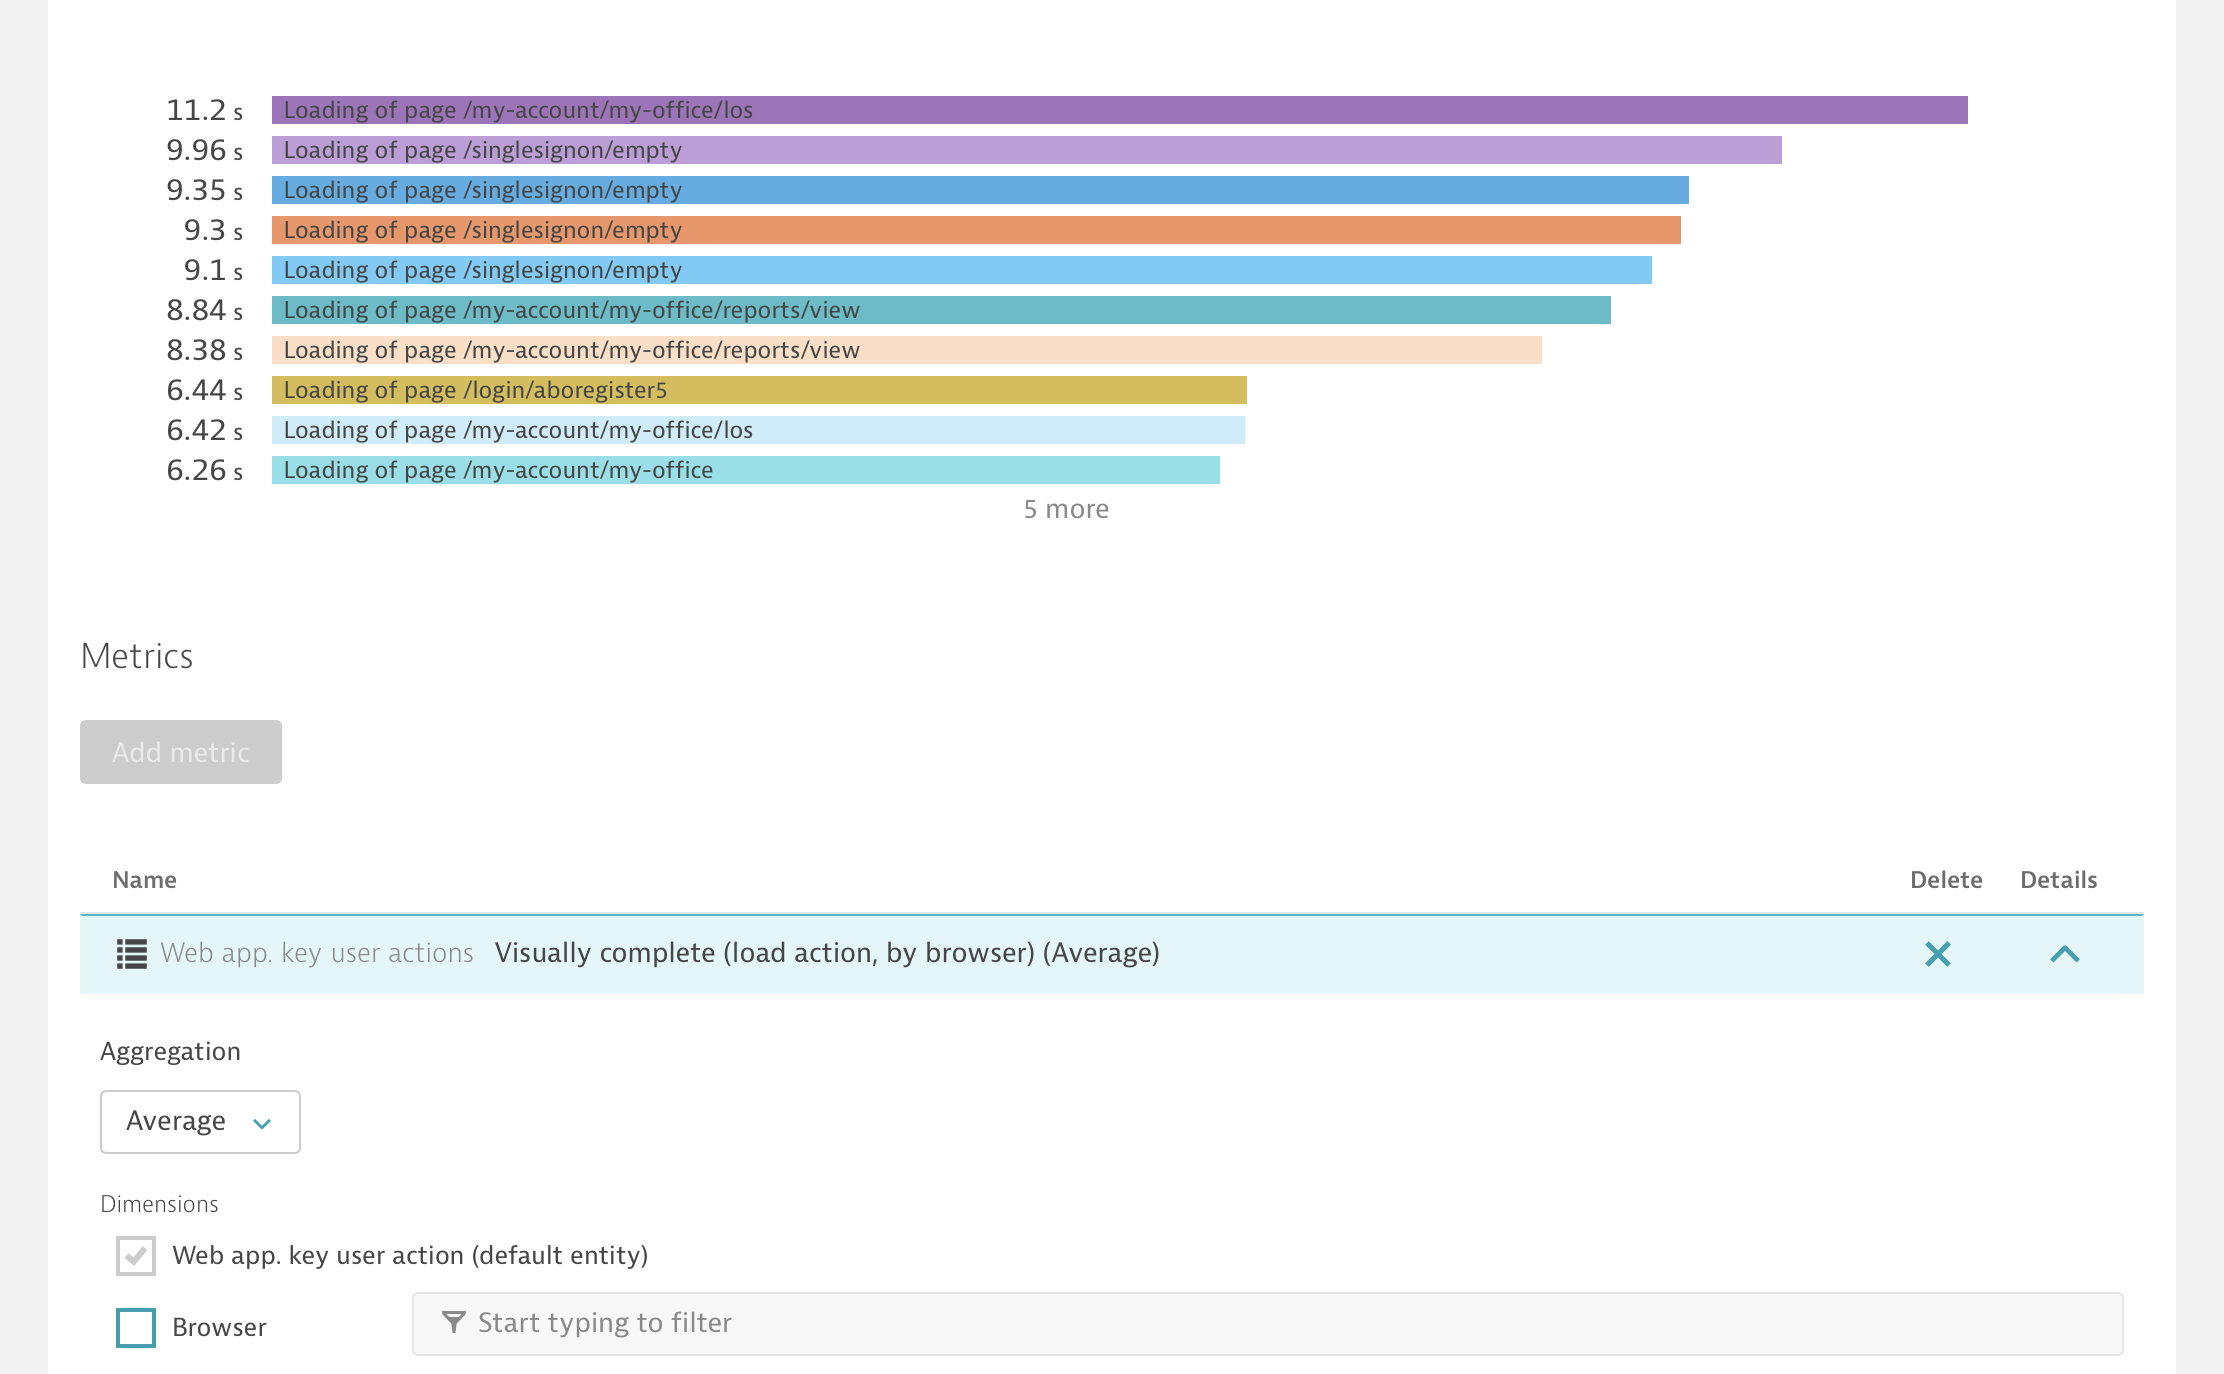
Here is right metric for Load Actions, remember about disabling Browser dimensions as on my screen. The same type of metric is available for XHR actions. I assume that you have updated managed environment 🙂

- Mark as New
- Subscribe to RSS Feed
- Permalink
21 Oct 2019 12:06 PM
Oh my...I was testing the Load Actions on Friday with Browser dimension disabled and since I only got two pages listed (since most of my key user actions are XHR actions) I moved on try million other thing but not the XHR actions itself.
Thank you Sebastian for your help and clearly it was an user issue this time 🙂
Featured Posts
