This website uses Cookies. Click Accept to agree to our website's cookie use as described in our Privacy Policy. Click Preferences to customize your cookie settings.
Real User Monitoring
User session monitoring, key user actions - everything RUM.
Turn on suggestions
Auto-suggest helps you quickly narrow down your search results by suggesting possible matches as you type.
- Community Home
- Platform
- Real User Monitoring
- Where does Frontend time show on User action contributors breakdown?
Options
- Subscribe to RSS Feed
- Mark Topic as New
- Mark Topic as Read
- Pin this Topic for Current User
- Printer Friendly Page
Options
- Mark as New
- Subscribe to RSS Feed
- Permalink
21 Apr 2020
03:33 PM
- last edited on
26 Apr 2021
11:31 AM
by
![]() MaciejNeumann
MaciejNeumann
Hi Experts, I am trying to understand the contributors breakdown for a load action and couldn't understand where does the frontend time show on the breakdown.
Question#1 -> Trying to chart with frontend time. If the frontend time metric is not available in applications metrics for a custom chart, suggest what is the other metric we can consider for measuring estimated frontend time?
Question#2 -> Please take a look at the screenshots, and help me in finding the frontend time from the breakdown.
Question#3 -> Appreciate if you explain how Dynatrace measures the Frontend time?
Solved! Go to Solution.
Labels:
- Labels:
-
user actions
-
user sessions
Reply
13 REPLIES 13
Options
- Mark as New
- Subscribe to RSS Feed
- Permalink
21 Apr 2020 03:49 PM
Answer for Question#3 from documentation

dynatrace certificated professional - dynatrace master partner - Matrix Soft Ware Division - Israel
Reply
Options
- Mark as New
- Subscribe to RSS Feed
- Permalink
21 Apr 2020 03:51 PM
thanks @Yos N. and I am trying to find where does Frontend time represent on User action breakdown?
Options
- Mark as New
- Subscribe to RSS Feed
- Permalink
21 Apr 2020 04:12 PM
I don't think so @Yos N. User action duration includes Frontend time and Network contribution excludes Frontend time.
Options
- Mark as New
- Subscribe to RSS Feed
- Permalink
21 Apr 2020 04:55 PM
You can chart this via the USQL - this is the best option as it stands now. As provided in the previous question string
-Chad
Reply
Options
- Mark as New
- Subscribe to RSS Feed
- Permalink
21 Apr 2020 05:05 PM
Your are right @Chad T. here it goes: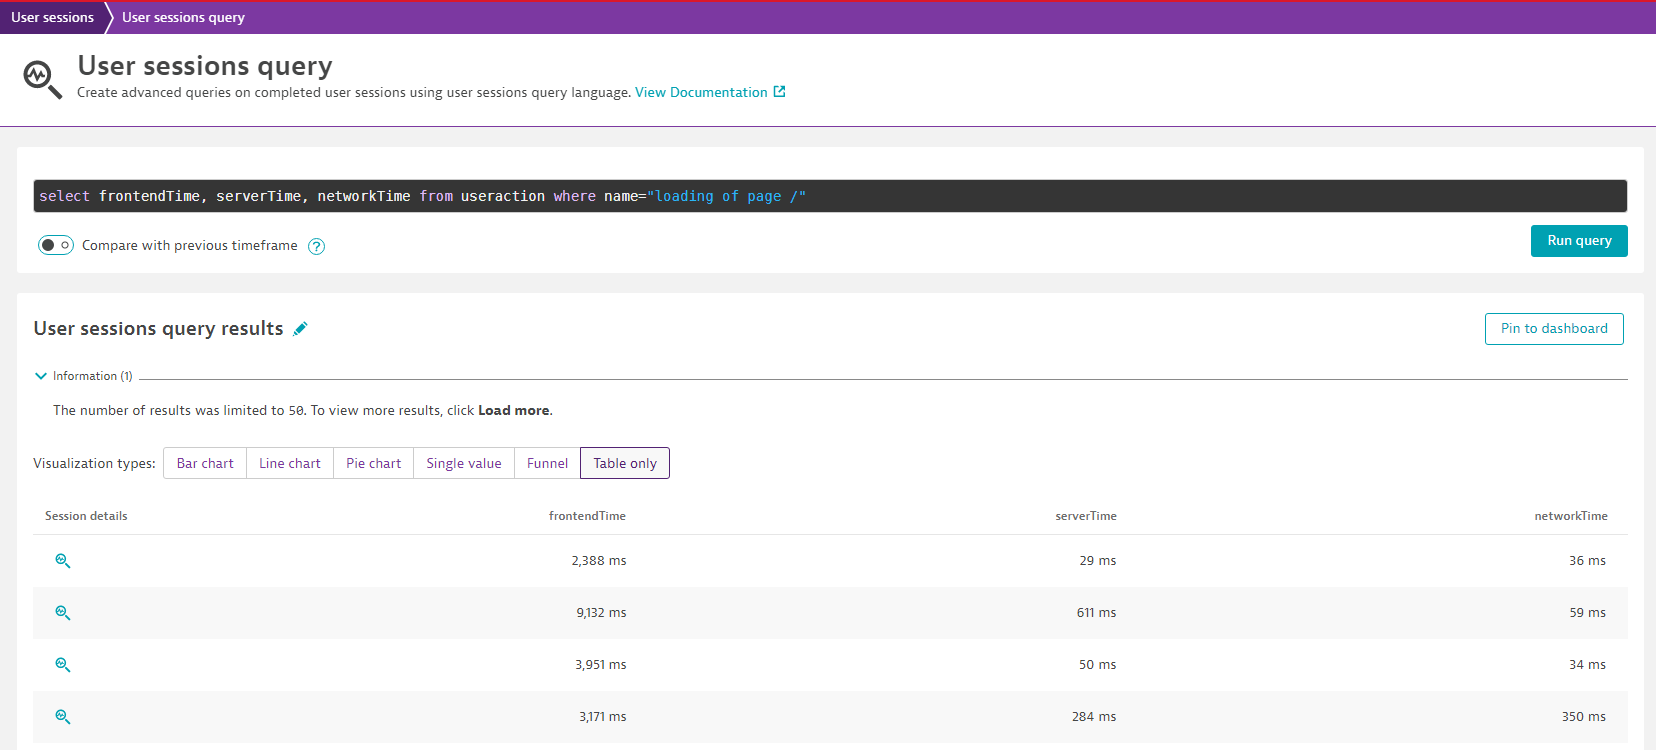
dynatrace certificated professional - dynatrace master partner - Matrix Soft Ware Division - Israel
Reply
Options
- Mark as New
- Subscribe to RSS Feed
- Permalink
10 Nov 2022 06:08 PM
Thanks for the query this is very helpful. Do you know if its possible to get the median value of each column? I am still new to doing queries
Options
- Mark as New
- Subscribe to RSS Feed
- Permalink
21 Apr 2020 07:24 PM
the Waterfall would be likely the best place to get a further break down of the times, rather than the infographic you provided - the frontend time User Action Duration - Server Consumption - Network Consumption. (Time spent in the browser on executing Javascript and rendering the page.) The waterfall analysis mainly provides a further break of the timings. Waterfall will generally show you client side, which includes front end timing, but front end is not easy to evaluate exactly as its not only related to front end performance but also user device/computer as well. I would say front end timing is only relevant when viewing it with the Waterfall analysis.
-Chad
Options
- Mark as New
- Subscribe to RSS Feed
- Permalink
21 Apr 2020 08:51 PM
Understood. Thanks @Chad T. for explaining it well.
Options
- Mark as New
- Subscribe to RSS Feed
- Permalink
21 Apr 2020 08:53 PM
you're very welcome!
-Chad
Options
- Mark as New
- Subscribe to RSS Feed
- Permalink
22 Apr 2020 12:54 AM
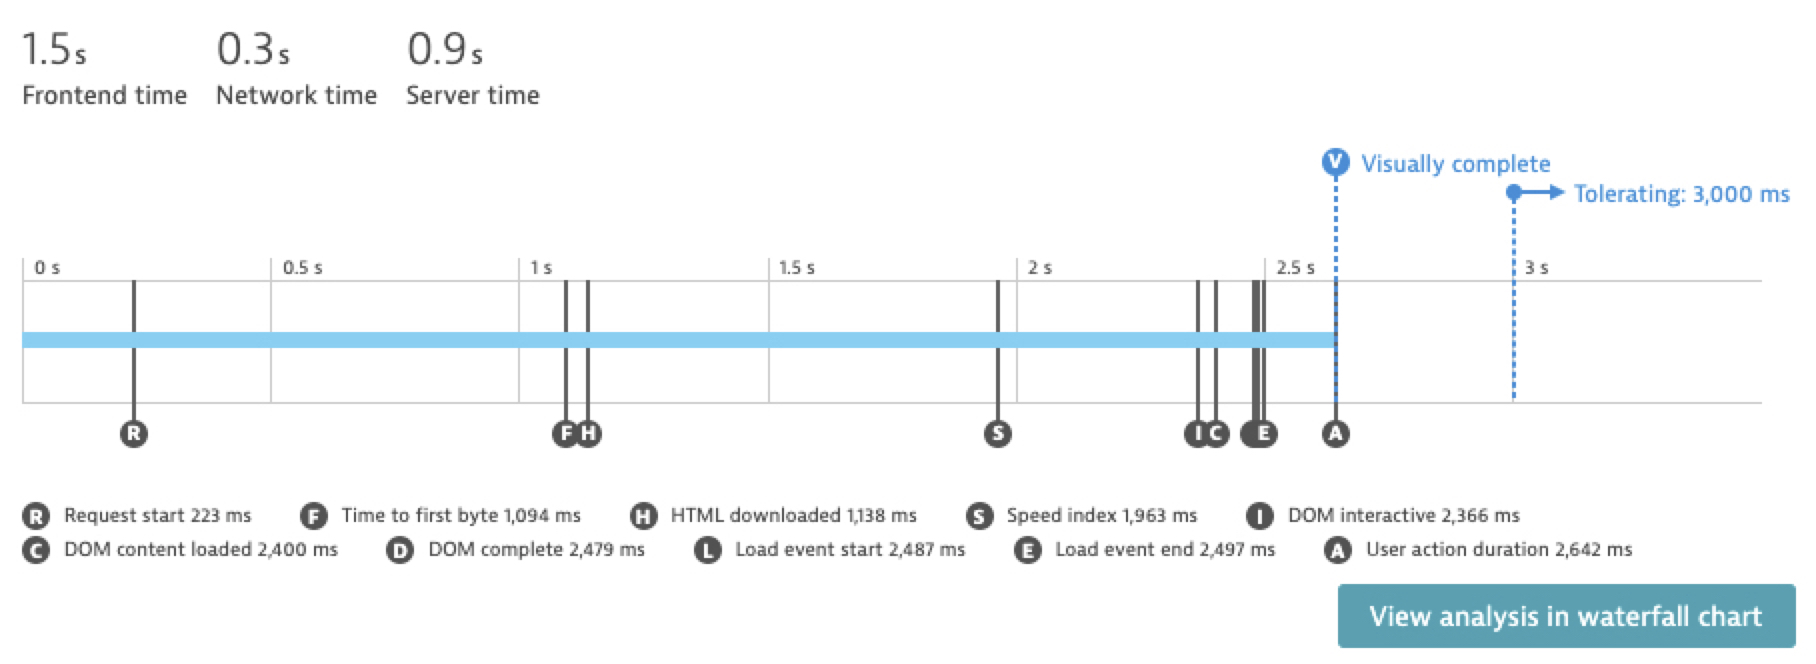
1.5S is the time the page "need" to be ready for customer usage (Visually complete)
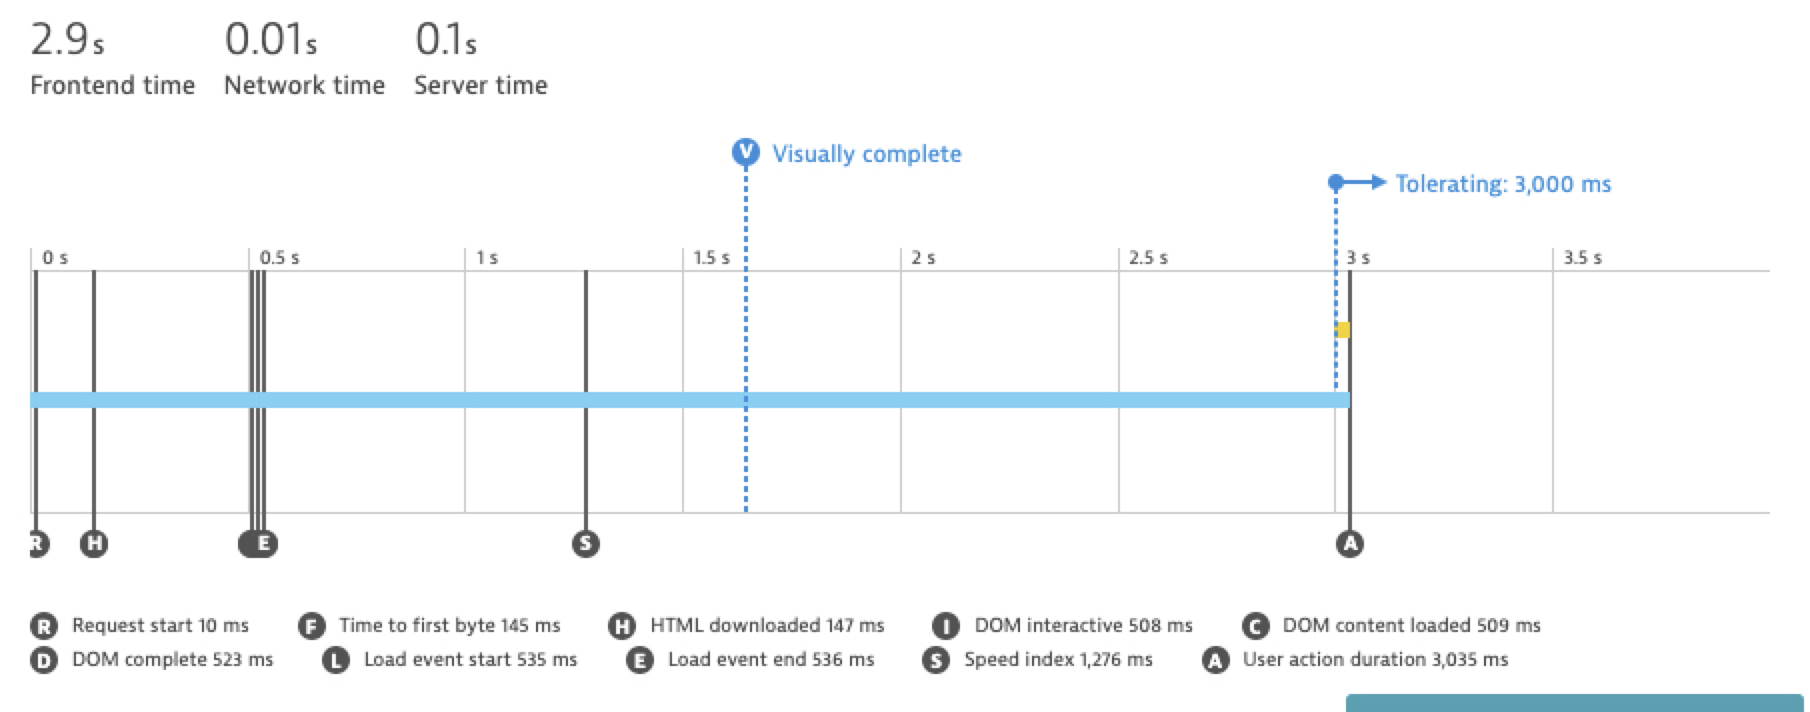
2.6S is the time needed to load all page component (User action duration)
Visually complete: Time spend from the Browser to render the page (user can click and perform actions)
User action duration: Full time spend from the Browser in order to load all page component.
Think about OnePage application loading all javascript deferred from other component (Above the folder Technic) .. user is working but page is still loading component from the server. (very long long page where user scroll or click next for a workflow page)
Note: Cached page can have less user action duration then visually complete ( check drill down)
So in a nut.. all depend about what you're looking for
Note: data aggregation from USQL can be different from data on this section. (due to retention period and different logic used for time series)
Br
M.
Reply
Options
- Mark as New
- Subscribe to RSS Feed
- Permalink
23 Apr 2020 03:23 PM
Thanks @Domenico B. this is very helpful for me to understand it better.
Reply
Options
- Mark as New
- Subscribe to RSS Feed
- Permalink
01 Dec 2020 05:28 PM
I agree that these metrics are useful and don't understand why it's not available for a given page as a dashboard metric. here is a good article that explains the value of this metric https://www.stevesouders.com/blog/2012/02/10/the-performance-golden-rule/
Featured Posts
