- Dynatrace Community
- Ask
- Synthetic Monitoring
- Synthetic Monitors Availability
- Subscribe to RSS Feed
- Mark Topic as New
- Mark Topic as Read
- Pin this Topic for Current User
- Printer Friendly Page
- Mark as New
- Subscribe to RSS Feed
- Permalink
25 May 2022 03:16 PM
Hello, I am looking for an API which will provide Health Metrics of Synthetic monitors at a particular time. I could get these detials using Monitored entity API, but the issue is Monitored Entity API gives either "Healthy" or "UnHealthy" Metric details for a particular managementZone. I looking for single API call to get the Healthy" or "UnHealthy" Metric details.
Thanks in advance.
Solved! Go to Solution.
- Labels:
-
synthetic monitoring
- Mark as New
- Subscribe to RSS Feed
- Permalink
25 May 2022 03:35 PM
Hi @Balamurugesh,
Will builtin:synthetic.browser.availability.location.total:splitBy("dt.entity.synthetic_test") as a metric will help you?
HTH
Yos
- Mark as New
- Subscribe to RSS Feed
- Permalink
25 May 2022 03:38 PM
Hi Yosi, can you share the sample curl command to get these detials?
- Mark as New
- Subscribe to RSS Feed
- Permalink
25 May 2022 03:43 PM
curl -X GET "{dynatrace host}/api/v2/metrics/query?metricSelector=builtin%3Asynthetic.browser.availability.location.total%3AsplitBy%28%22dt.entity.synthetic_test%22%29&resolution=1d&from=now-90d&to=now" -H "accept: application/json; charset=utf-8" -H "Authorization: Api-Token {api token}"
- Mark as New
- Subscribe to RSS Feed
- Permalink
25 May 2022 03:55 PM
Above request provides Availability metrics of monitors. I am looking for an API which will give if a moniotr is up or down at a particular time. Right now, am using below curl command:
Request:
curl -X GET "{url}/api/v2/entities?entitySelector=mzName%28%22{mzName}%22%29%2CTYPE%28%22{Monitor_Type}%22%29%2ChealthState%28%22HEALTHY%22%29"
-H "accept: application/json; charset=utf-8"
-H "Authorization: Api-Token {KEY}"
but the issue is, it provides either healthy or unhealthy details at a time. but am looking for an API which will give both details.
- Mark as New
- Subscribe to RSS Feed
- Permalink
25 May 2022 04:22 PM
@Balamurugesh please pay attention to the resolution, from & to parameters in the call
In the follows example the resolution is 1d and the time frame is 90 days ago
curl -X GET "{dynatrace host}/api/v2/metrics/query?metricSelector=builtin%3Asynthetic.browser.availability.location.total%3AsplitBy%28%22dt.entity.synthetic_test%22%29&resolution=1d&from=now-90d&to=now" -H "accept: application/json; charset=utf-8" -H "Authorization: Api-Token {api token}"
You can run the query for the last 5minutes with 1 minute resolution and the get the availability per synthetic check, and now you can decide if 100% is up and less is down for example
explanations for setting resolution
And for from & to
HTH
Yos
- Mark as New
- Subscribe to RSS Feed
- Permalink
25 May 2022 05:00 PM
Got it. Can i pass all the monitor types in the same request? in the above example you are passing Browser clickpath monitor, how to pass browser clickpath and HTTP ping in a single request?
- Mark as New
- Subscribe to RSS Feed
- Permalink
25 May 2022 05:06 PM
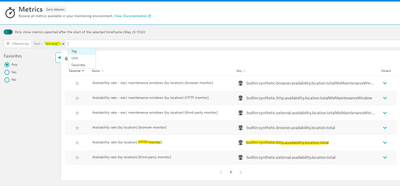
For http checks you will need to use its metric: builtin:synthetic.http.availability.location.total
For finding all metrics you can look at metric page and filer them by text for example:
HTH
Yos
- Mark as New
- Subscribe to RSS Feed
- Permalink
25 May 2022 06:51 PM
can i pass both browser clickpath and http monitors metrics in a single request?
- Mark as New
- Subscribe to RSS Feed
- Permalink
25 May 2022 03:53 PM
More details on the Get Metrics Data Point API
https://www.dynatrace.com/support/help/dynatrace-api/environment-api/metric-v2/get-data-points
Featured Posts


